Fig. 2.
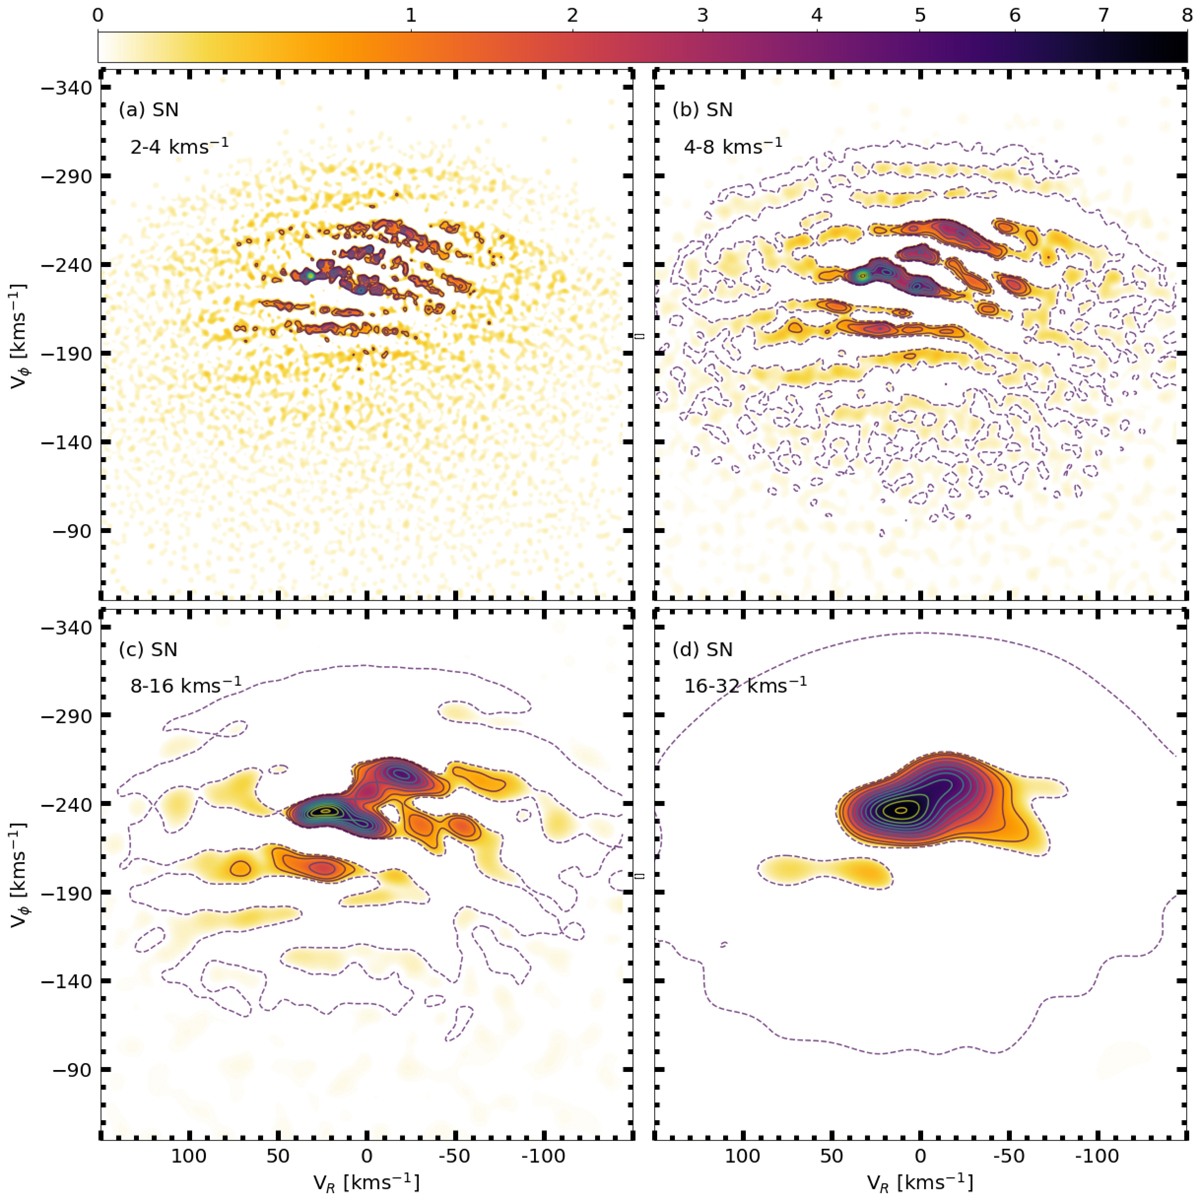
Wavelet planes highlighting the velocity substructure in the SN at different scales. The panels correspond to scales from j = 2 (panel a) to j = 5 (panel d). The colour bar shows only the positive coefficients, just like the solid-line contours, which are shown for different percentages of the maximum coefficient at levels from 10% to 90% every 10%, plus 5% and 99%. Additionally, the negative coefficients are represented by the dashed-line contour at the −1% level. With the values used (see text), the Sun would be located at (−11,−252) km s−1
Current usage metrics show cumulative count of Article Views (full-text article views including HTML views, PDF and ePub downloads, according to the available data) and Abstracts Views on Vision4Press platform.
Data correspond to usage on the plateform after 2015. The current usage metrics is available 48-96 hours after online publication and is updated daily on week days.
Initial download of the metrics may take a while.