Fig. 1.
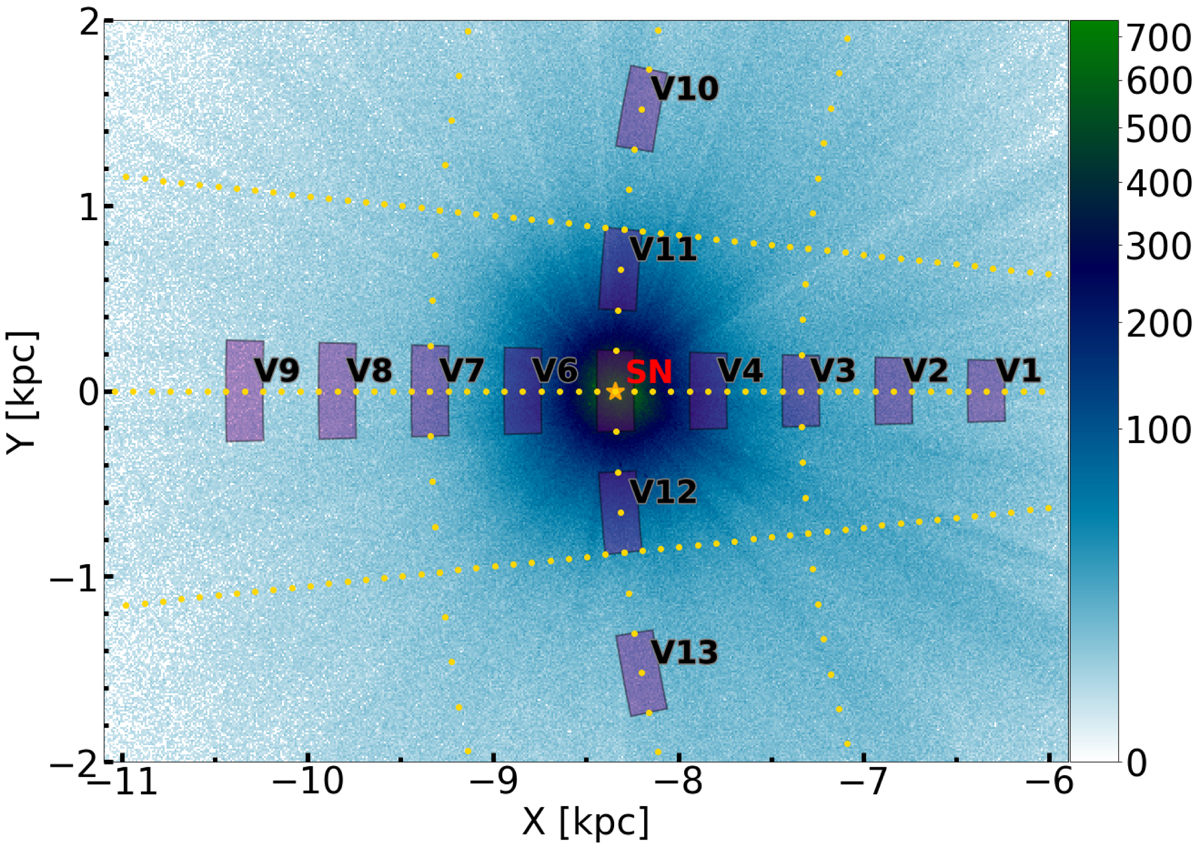
Distribution of the sample in configuration space. We show the histogram of the 5 136 533 stars (see text) with a binning of 10×10 pc. The Sun is shown as an orange star and the GC is located at (X, Y) = (0, 0). The golden dots indicate the centres of the volumes used for the exploration in different Galactic neighbourhoods. Each radial line contains 51 volumes, and each arch at fixed radius has 21 volumes. The purple patches correspond to the sub-samples from the wider grid for which we perform a detailed study of their velocity distribution. The properties of these sub-samples are summarised in Table 1.
Current usage metrics show cumulative count of Article Views (full-text article views including HTML views, PDF and ePub downloads, according to the available data) and Abstracts Views on Vision4Press platform.
Data correspond to usage on the plateform after 2015. The current usage metrics is available 48-96 hours after online publication and is updated daily on week days.
Initial download of the metrics may take a while.