| Issue |
A&A
Volume 619, November 2018
|
|
|---|---|---|
| Article Number | A23 | |
| Number of page(s) | 17 | |
| Section | Catalogs and data | |
| DOI | https://doi.org/10.1051/0004-6361/201833360 | |
| Published online | 30 October 2018 | |
A MST catalogue of γ-ray source candidates above 10 GeV and at Galactic latitudes higher than 20°⋆
1
INAF/OAS-Bologna, via Piero Gobetti 101, 40129 Bologna, Italy
e-mail: This email address is being protected from spambots. You need JavaScript enabled to view it.
2
INAF/IAPS, via Fosso del Cavaliere 100, 00133 Roma, Italy
3
In Unam Sapientiam, Piazzale A. Moro 2, 00185 Roma, Italy
4
INFN-Sezione di Roma Tre, via della Vasca Navale 84, 00146 Roma, Italy
5
Dipartimento di Matematica e Fisica, Università Roma Tre, Roma, Italy
Received:
4
May
2018
Accepted:
1
August
2018
Abstract
We describe a catalogue of γ-ray source candidates selected using the minimum spanning tree (MST) algorithm on the nine year Fermi-LAT sky (Pass 8) at energies higher than 10 GeV. The extragalactic sky at absolute Galactic latitudes above 20° has been investigated using rather restrictive selection criteria, resulting in a total sample of 1342 sources. Of these, 249 are new detections that have not been previously associated with γ-ray catalogues. A large portion of these candidates have interesting counterparts, which are most likely blazars. In this paper, we report the main results of the catalogue selection and search of counterparts.
Key words: gamma rays: general / gamma rays: galaxies / methods: data analysis
The catalogue is only available at the CDS via anonymous ftp to cdsarc.u-strasbg.fr (130.79.128.5) or via http://cdsarc.u-strasbg.fr/viz-bin/qcat?J/A+A/619/A23
© ESO 2018
1. Introduction
The Large Area Telescope (LAT; Ackermann et al. 2012) on board the Fermi mission has been continuously observing the sky at energies higher than ∼100 MeV since the beginning of August 2008. This mission has collected a very large number of photons and enriched our knowledge on Galactic and extragalactic high-energy astrophysics. One of the most relevant achievements of this mission is the discovery of thousands of new celestial sources of γ-rays, which have been reported in several catalogues covering different time wxindows, energy ranges, and source types.
Various methods for detecting point-like sources against the photon and instrumental background are based on the search of local concentrations of γ-rays. Besides the traditional maximum likelihood (ML) algorithm (Mattox et al. 1996), other methods include the use of wavelet transform (Damiani et al. 1997; Ciprini et al. 2007), the density-based clustering algorithm DBSCAN (Tramacere & Vecchio 2013; Armstrong et al. 2015) the Bayesian inferential D3PO algorithm (Selig et al. 2015), and FermiFAST, recently proposed by Asvathaman et al. (2017).
One method, which was initially proposed by Di Gesù & Sacco (1983) for the analysis of data from the COS B satellite (Bignami et al. 1975), is based on an application of the topometric minimum (or minimal) spanning tree (hereafter, MST) algorithm, which has its roots in graph theory. Campana et al. (2008, 2013) developed this method and introduced new estimators for the cluster significance to be applied to γ-ray two-dimensional images in which the points correspond to the arrival directions of photons. The MST method was applied to search source seeds in preparation of the early Fermi catalogues (1FGL; Abdo et al. 2010; 2FGL, Nolan et al. 2012; 1FHL, Ackermann et al. 2013b). In a subsequent series of papers (Campana et al. 2015, 2016a,b,c; hereafter Papers I–IV) we analysed the Fermi-LAT dataset by means of MST and found several significant γ-ray photon overdensities associated with blazars previously not known as high-energy sources.
In this paper we report a new catalogue of γ-ray clusters, which are robust point-like source candidates that were selected using the MST algorithm in the sky at Galactic latitudes |b| > 20° and at energies higher than 10 GeV. In this work we considered the Pass 8 Fermi-LAT photons observed since the beginning of the mission up to August 2017, thus covering a period of nine years. The aim of our search was to enrich the population of weak high-energy sources and to search for their possible counterparts, particularly among confirmed and candidate blazars, which constitute the most numerous class of extragalactic γ-ray sources.
Our sample contains 1342 entries: about 81% of these have a close spatial association with known -ray sources reported in public catalogues or surveys, and a further ∼8% can be associated with known and candidate blazars not previously known as γ-ray emitters.
In Sect. 2 the MST method is briefly outlined; in Sect. 3 the data reduction, MST analysis, and selection tools are described. The catalogue content and characteristics are described in the following sections, and in Sect. 9 we discuss our results.
2. Photon cluster detection with the MST algorithm
The MST (Campana et al. 2008, 2013) is a cluster-detection algorithm useful for searching spatial concentrations in a field of points. As stated in the Introduction, we already applied this method to the γ-ray sky and detailed descriptions of the MST and the selection criteria were presented elsewhere (e.g. in Paper I), therefore, in this work we provide only a brief summary of this method.
Consider a two-dimensional set of n points or nodes: several sets {λi} of weighted edges connecting these nodes can be defined. For a set of points in a Cartesian frame, the edges are the segments joining the nodes and the weights are their Euclidean lengths, while for a region on the celestial sphere the edge weights are the angular distances between pairs of photons. The MST is defined as a (unique) tree, i.e. a graph connecting all the nodes without closed loops, which has a minimum total weight defined as min[Σiλi].
Once the MST is computed by means, for example, of the Prim algorithm (Prim 1957), a set of subtrees corresponding to clusters of photons is extracted by means of a twofold selection, consisting firstly of a separation, removing all the edges having a length λ > Λcut. The separation value can be defined in units of the mean edge length Λm = (Σi λi)/n. This results in a set of disconnected subtrees; then, an elimination removes all the subtrees that have a number of nodes N ≤ Ncut, leaving only the clusters over a fixed threshold in size. The remaining set of subtrees provides a first list of candidate clusters and a secondary selection is applied to extract the most robust candidates as γ-ray sources. A suitable parameter for this selection (Campana et al. 2013) is the clustering parameter gk defined as the ratio of Λm to λm,k, the mean length of the kth cluster edges. Another very useful parameter for assessing the significance of the surviving clusters is the cluster magnitude
 (1)
(1)
where Nk is the number of nodes in the cluster k and gk its clustering parameter. The probability to obtain a given magnitude value combines that of selecting a cluster with Nk nodes together with its “clumpiness”, compared to the mean separation in the field. It was found that  is a good estimator of statistical significance of MST clusters (Campana et al. 2013). In particular, a lower threshold value of M around 15–20 would reject the large majority of spurious (low significance) clusters.
The cluster centroid coordinates are obtained by means of a weighted mean of the coordinates of the photons (Campana et al. 2013). If the cluster can be associated with a genuine pointlike γ-ray source, the radius of the circle centred at the centroid that contains 50% of the photons in the cluster, the median radius Rm, should be smaller than or comparable to the 68% containment radius of instrumental point spread function (PSF; see Ackermann et al. 2013a). Another useful parameter is the maximum radius Rmax, defined as the angular distance between the centroid and the farthest photon, giving information regarding the overall extension of the cluster. Table 1 reports a summary of the main parameters in the MST source detection algorithm.
Summary of the main parameters in the MST source detection algorithm and their meaning.
3. The MST catalogue
3.1. The Fermi-LAT dataset
The full Fermi-LAT dataset collected above 10 GeV in the nine years from 2008 August 4 to 2017 August 4, and processed with the Pass 8 reconstruction algorithm and responses, was downloaded from the FSSC archive1. The standard cuts on data quality and zenith angle (SOURCE class events, front and back converting, up to a maximum zenith angle of 90°) were applied.
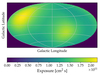 |
Fig. 1. Sky map of the Fermi-LAT exposure at 10 GeV in the first 9 years of observation in scanning mode. |
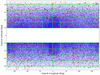 |
Fig. 2. Sky map of the photons in the 10–300 GeV energy range considered in our analysis. Green lines indicate the boundaries of the regions used for the MST cluster search. Red dots are the clusters given in the final 9Y-MST catalogue. |
The scanning mode of Fermi-resulted in a non-uniform exposure distribution over the sky with a maximum value near the north celestial pole and minimum exposure on the celestial equator, as apparent in the map reported in Fig. 1.
The detection of photon clusters, performed by means of MST, depends upon the mean spatial density of background events, which largely increases moving from the Galactic poles to the equator. For this reason we removed from the data the region with |b| < 19°, where the clusters found (in particular those with a small number of photons) are not sufficiently stable, i.e. their number of photons changes drastically even for small variations of the Λcut parameter. The final dataset contains 291 979 photons, of which 152 906 and 139 073 are in the north and south Galactic regions, respectively. This difference is mainly due to the nonuniform spatial distribution of the exposure.
Sky regions used in the MST search for photon clusters.
3.2. Primary selection
To take into account the differences in the photon density, we divided the full non-Galactic sky into three strips 17° wide in Galactic latitude for each hemisphere, allowing for a 2° overlap between the adjacent regions. The boundaries of these regions are illustrated in the sky map in Fig. 2. The strip nearest to the Galaxy was subdivided in four longitude sectors, while the other two strips were split in two sectors. The north and south Galactic polar regions (|b| > 79°) were analysed separately.
For each field the MST was computed on the unbinned photon maps applying a primary selection using Λcut = 0.7 Λm and Ncut = 3. These values have been shown (Campana et al. 2015, 2016a) to be rather optimal for further selections. The resulting cluster samples were merged and a first preliminary list of 6503 clusters was obtained. The selected regions, their solid angles, photon numbers, and the used absolute Λcut are summarized in Table 2; we also report the number of clusters Nps found in each region with only the primary selection. We note that the separation length, when measured in arcmin, remains uniform in many regions with the exception of the southern highest latitude belt and polar region, where it is longer than 10′ since these fields are more sparse than the northern counterpart, and therefore also larger than the PSF radius. As a consequence of this fact, in these three regions the number of clusters is much higher than in the corresponding northern regions despite the lower photon numbers.
3.3. Secondary selections
We applied firstly a uniform secondary selection over the entire cluster dataset. We assumed a threshold value of M > 15, while for the four-photon clusters only (N = 4) a looser threshold of M > 12 was applied to take into account all those having g > 3. Moreover, multiple coincident clusters in the overlapping regions were eliminated taking only those with the highest M. We thus obtained a list of 2153 candidate sources.
We then applied a further “superselection” using different criteria for different sky regions. This has been proved to be an efficient strategy to take into account the backgrond non-uniformities, especially in peri-Galactic regions and in the so-called Fermi Bubbles Bubbles (Su et al. 2010), and to increase the chance to select clusters corresponding to genuine candidate -ray sources. We note that with the superselection we further restrict the analysis to Galactic latitudes |b| > 20°.
We defined the following four regions and characterized each region by a specific threshold on M and g:
High latitudes and poles, |b| > 50°: M > 18 or g > 3.5;
Middle latitudes, 30° < |b| < 50°: M > 20 or g > 4.0;
External peri-Galactic belt, 20° < |b| < 30° with 0° < L < 330°: M > 22 or g > 4.2;
Central peri-Galactic belt, 20° < |b| < 30° with −30° < L < 30°: M > 24 or g > 5.0.
We note that the “or” above is to be intended in Boolean sense, i.e. for the Galactic poles we select the clusters that have either M > 18 or g > 3.5.
The choice of these superselection parameters was based on the experience from previous analyses, aiming at selecting a population having a large majority of significant structures and is further justified in the following Sect. 3.4. The cumulative distributions of the cluster parameters M and g are shown in the two panels of Fig. 3, after the primary and secondary selections. In the figure some representative cut levels are indicated, showing that the percentage of surviving clusters after both selections.
The validity of our selection criteria is further confirmed by the percentage of clusters with associations to known sources or other interesting objects, higher than 95%, as discussed in the following sections.
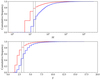 |
Fig. 3. Upper panel: cumulative distributions of the magnitude M of the clusters after the primary (red) and secondary (blue) selections. Vertical bars correspond to the cuts M > 15.0 and M > 20.0. Lower panel: cumulative distributions of the clustering parameter g of the same cluster sets. Vertical bar corresponds to the selection thresholds g > 3.0 and g > 3.5. |
After applying these criteria the number of candidate sources is reduced to 1342. This number, about 20% of the original primary selection clusters, is therefore comparable (i.e. about the same order of magnitude) to the amount of sources already detected in the same sky region, for example in the 3FHL or 3FGL catalogues. The distribution of these clusters into the regions used in our analysis is also given in Table 2 as Nss, not including double and multiple detections in the overlapping areas. It is interesting to note how the large excesses of clusters after the primary selection in the regions with a low photon number is now largely reduced. The superselection is therefore able to clean up the majority of low significance strucures, up to about 90% in some regions. Of course, we cannot exclude that a fraction of clusters associated with genuine high-energy sources is also eliminated, but such a choice is a necessary trade off for obtaining a good sample of significant clusters.
These clusters are all included in the nine year MST (9Y-MST) catalogue FITS file available as additional electronic material2. The FITS contains cluster information (coordinates, N, g, M, Rm, and Rmax) and the associated counterparts discussed in the following sections. The sky map of the clusters is shown in Fig. 2. The distributions of the N, g, and M parameters for all the 9Y-MST sources are shown in Fig. 4, while those of Rm and Rmax are given in Fig. 5.
We note that there are a few very rich clusters (N > 100) and, in particular, only two have more than 1000 photons and are associated with two well-studied BL Lac objects: PG 1553+113 (5BZB J1555+1111) with 1010 photons, and Mrk 421 (5BZB J1104+3812) with 1997 photons. The Rm and Rmax distributions are remarkably different, since the latter is peaked around 10′ and extends up to 55′, while more than 96% of clusters have Rm < 8′.
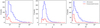 |
Fig. 4. Distribution of the N, g, and M parameters for all the 9Y-MST sources (blue histograms) and for the unassociated sources only (red histograms, see main text for details). |
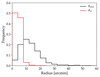 |
Fig. 5. Distributions of Rmax(black histogram) and Rm(red histogram) for all the 9Y-MST sources. Nearly all clusters have Rm values smaller than 8′, while the other distribution is peaked around 10′. |
The scatter plots of the radii (Rm and Rmax) versus the cluster photon number are shown in Fig. 6. Their difference is clear: in particular, for the richest clusters Rm is very close to 4ʹ̣5, while the maximum radius is an order of magnitude larger. This finding indicates that in the surroundings of large clusters there is a tendency to find angular distances that are shorter than Λm in the entire region with the aggregation of extended haloes. An interesting case is that of clusters with a rather low number of photons but a large Rm. These clusters could be either extended structures or those with a denser subcluster associated with nearby background photons. In general these clusters are also characterized by a low clustering factor, and their properties are discussed in Sect. 6.2. Another item to take into account is the possibility to find small spurious clusters in the close surroundings of a very rich cluster: for this to occur, it is enough to cut only one edge connecting the two structures. The usual terminology is to call these “satellite” clusters of the main cluster; see Campana et al. (2013). This matter is further discussed in Sect. 8.
3.4. Occurrence of spurious clusters
The above discussed superselection rules were chosen and applied to reduce the possibility to include clusters originated by local fluctuations of the background in the final sample, i.e. spurious clusters not corresponding to a real source. Evaluating the expected fraction of spurious structures in the catalogue is a complex task, but an estimate is useful to understand the quality of the selection methods. Campana et al. (2013), on the basis of simulations with random fields, found that selections with thresholds on M ranging from 15 to 20 produce a low fraction (≲10%) of these spurious clusters. However, simply using a high M selection threshold does not give particularly interesting results, since the most likely outcome is a sample containing bright sources that can be found with any other method. Our main goal is to select clusters that can be associated with new sources: this implies that they can also have a low photon number. For these reasons we also applied a selection on g. Moreover, we have to consider the possibility to select structures with M values above the threshold but with low clustering as expected from extended or “confused” features.
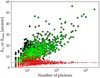 |
Fig. 6. Scatter plots of the maximum radius Rmax (black points) and of the mean radius Rm (red points) vs. the number of photons in the clusters for all the 9Y-MST sources. We note that for high photon number the mean radius is very close the constant value of 4ʹ̣5 (horizontal line). Green crosses overlaid on the black points indicate the 3FGL counterparts to the 9Y-MST clusters. |
To evaluate the expected fraction of spurious clusters we performed numerical simulations on a photon background similar to that observed. A simulated nine year > 10 GeV Fermi-LAT sky was generated using the gtobssim tool3, including only the Galactic and isotropic diffuse backgrounds (gll_iem_v06 and iso_P8R2_SOURCE_V6_v06) and assuming the same spacecraft attitude as the actual dataset. The MST algorithm was applied using the same procedure and primary selection parameters as for the real data: in particular, the absolute value of Λcut, i.e. measured in degrees, was fixed to the adopted value in the selection on the true field. Afterwards, the superselection criteria were applied to the simulated data as well. The resulting percentage of spurious clusters surviving to this procedure was ∼4%. This implies that an estimate of the possible spurious cluster between the 1342 entries in the catalogue gives a number of about 55 clusters, most of which have 4 or 5 photons. However, slightly higher numbers of spurious clusters cannot be excluded, since the presence of many rich clusters in the true sky affects the MST construction in a way that it is difficult to reproduce in any simulation.
Other spurious clusters can be present if there are significant photon density gradients, as observed in the regions near the Galactic belt, where it is possible to select low g clusters close to the low |b| boundaries where the photon density increases. Not all these clusters may be spurious. Some could be associated with real sources, considering that the number of Galactic γ-ray emitters can also increase at low latitudes. In these cases, an analysis of small regions (typically having a size of 10°×10°) with decreasing Λcut values can help to verify whether these structures remain stable or they dissolve into the background. In the latter occurrence, this is a strong indication that the cluster could be spurious. In the catalogue, a flag is reported in these ∼20 cases.
4. Correspondence between 9Y-MST and Fermi catalogues
We searched for the correspondences between our 9Y-MST clusters with the two most recent main catalogues published by the Fermi collaboration: the 3FGL catalogue (Acero et al. 2015), including 3034 γ-ray sources detected in the energy range 0.1 < E < 300 GeV; and the 3FHL catalogue (Ajello et al. 2017), including 1556 sources at energies higher than 10 GeV. The former catalogue was based on the first four years of LAT data, while the latter considered photons detected in a time interval of seven years. The sources in these two catalogues are distributed over all the sky and there are 1715 and 986 for the 3FGL and 3FHL, respectively, in the same field considered for the MST catalogue with |b| > 20°.
4.1. 3FHL catalogue
We searched first the associations of 9Y-MST clusters with the 3FHL catalogue because of their similar energy ranges, within a maximum separation of 20′, and obtained 923 correspondences. The distribution of the separations is shown by the red histogram in Fig. 7. About all the sources (916, 99.2%) are found within a maximum distance δ of 6′. We can conclude that this value can be adopted in other searches when at least one of the source positions is known with a much higher precision, as in the case of optical or radio catalogues. In the search for associations between MST clusters and 3FHL sources the choice of a matching radius of 6′ (0°.1) can be also based on the distribution of the semimajor axis of positional error ellipse at 95% confidence of the 3FHL sources (“Conf_95_SemiMajor” parameter in the 3FHL catalogue), which is smaller than this value for almost all (>99.3%) sources.
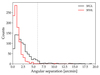 |
Fig. 7. Histograms of the angular distances δ between the clusters in the 9Y-MST catalogue and the sources in the 3FHL (red) and 3FGL (black) catalogues. The dashed vertical line indicates the matching distance of 6′ assumed for the 3FHL associations. |
For farther distances, at δ = 6ʹ̣5 there is only one cluster associated with a 3FHL source: 9Y-MST J0529−6904, which has 34 photons and Rmax = 26ʹ̣3. This is an indication that it is clearly extended because it is also located within the Large Magellanic Cloud. No sources are found with 6ʹ̣5 < δ < 10′. At larger angular separations, 10′ < δ < 20′, we have six possible matches. Five are multiple associations (i.e. there is another 3FHL source within 20′ from the 9Y-MST cluster, or vice versa), and only one is a single association. The latter is the cluster located at RA = 269°.959; Dec = 70°.612 at an angular distance of 14ʹ̣6 from 3FHL J1757.7031 (corresponding to 3FGL J1756.9+7032), which has the BL Lac counterpart 5BZB J1757+7033; this angular distance appeared too large for a correct matching and we verified that there is a cluster very close to the 3FHL source position with seven photons and M = 21.71, just below the superselection threshold for this region. We, therefore, considered the cluster as not associated with the 3FHL source and included it in the catalogue; we stress that this choice is strengthened by the fact that it is at 1ʹ̣1 to the other BL Lac object 5BZB J1759+7037. The angular separation distribution thus indicates that the correct matching distance for the search of counterparts is within 6′ and that the few sources found at higher separations are either random associations or peculiar occurrences.
It is clear that such a high percentage of associations cannot be due to chance correspondences between the two catalogues. However, it cannot be excluded that some associations might actually be spurious. We therefore evaluated how many correspondences are expected from a cross matching of two catalogues with similar large scale distributions.We thus constructed a set of fake catalogues with the same number of 9Y-MST clusters but coordinates shifted in RA and Dec by variable amounts ranging from 0°̣5 to 3°̣5. The cross-matching analysis with the true 3FHL catalogue within 6′ gave a number of correspondences ranging from 0 to 4, with a mean value equal to 1.5 and a standard deviation of 1.35. Thus, it is reasonable to consider as genuine all 916 associations (92.9% of the 3FHL catalogue sources). For a further discussion on the matching radius, see also Campana et al. (2015).
We then searched for the remaining 70 not associated 3FHL sources in the initial list of 2153 pre-superselection clusters, and 60 corresponding associations were found. These clusters were excluded from the 9Y-MST catalogue because they do not fulfil the requested severe selection criteria. In particular, although nine of them had M > 22.0 or g > 4.2 they were however rejected being located in the region near the Galactic Bulge.
Therefore, there are only 10 3FHL sources not associated with MST clusters: all of these sources are reported in the 3FHL with usually a rather low significance. We can then conclude that ∼99% of the 3FHL sources were found by our MST method and a further ∼6% were rejected by the superselection criteria.
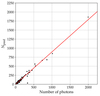 |
Fig. 8. Number of photons N for the 9Y-MST clusters with a 3FHL counterpart vs. the number of ML predicted photons Npred. The red line is the linear best fit. |
It is interesting to compare, for the matching MST-3FHL clusters, their number of photons N with the number of predicted photons Npred from the ML analysis, reported in the 3FHL catalogue. Figure 8 shows this comparison: an excellent linear agreement with the two quantities is found with a slope ∼0.9 and an intercept compatible with 0 at the 2σ level. The only significant outlier is 3FHL J2232.7+1143, for which a cluster with 328 photons (M∼ 3120) is found but the 3FHL catalogue reports Npred = 34.17. This source (also known as CTA 102) had a significant outburst in late 2016, thus outside the 3FHL data range.
4.2. 3FGL catalogue
The search for associations between MST clusters and the 1715 3FGL sources in the same sky region resulted in 943 matchings within a maximum angular separation of 20′ (55.2%, Fig. 7). The fact that many sources of this catalogue are not associated with clusters is likely a consequence of the different energy ranges considered: the majority of the photons for the 3FGL sources have energies below 10 GeV down to 100 MeV. Moreover, the use of lower energy bands (characterized by a broader PSF) loosens the positional accuracy of the 3FGL sources, allowing for higher δ values. This is apparent from the δ distribution (black histogram in Fig. 7), which is much broader with respect to the 3FHL sources.
In this case, we can consider δ = 15′ as the threshold for a genuine association with the 3FGL catalogue. We note that about 96% of the sources in the 3FGL catalogue have a positional error ellipse semimajor axis smaller than this value.
There are 2 MST sources that could be associated within 15′ from the 3FGL J0849.3+0458 source, 9Y-MST J0849+0456 at δ = 6ʹ̣2 and 9Y-MST J0848+0507 at δ = 13ʹ̣2. At a closer look to the photon distributions, it is clear that these are two distinct associations; the 3FGL source is associated with the closer MST cluster, while the farthest cluster has a very good association with a 3FHL source (3FHL J0848.7+0508).
There are only 8 sources with 15′ < δ < 18′. It is possible that some of this group are spurious associations, and therefore they are examined in the next subsection. Interestingly, 783 sources (i.e. about 83% of the entire sample) are found within δ < 4′, and 885 (∼94%) within δ < 6′ confirming the accuracy of these positional estimates.
Thus, we consider as genuine 935 associations with the 3FGL catalogue (within 18′, 54.5% of the sample). Finally, we note that only 792 of the 935 associated 3FGL sources are also in the 3FHL catalogue within a distance of 6′. Thus, with the MST method, above 10 GeV, 143 3FGL sources not previously found in the 3FHL are detected. The total number of clusters in the 9Y-MST associated with either 3FHL or 3FGL is thus equal to 1060.
4.3. Possible association with 3FGL sources at large angular distances
As mentioned above, eight 9Y-MST clusters have angular distances from possible 3FGL counterparts greater than 15′ but smaller than 18′. An effective way to investigate the robustness of these associations is to perform a MST analysis on smaller fields around the possible associations, usually a few degrees wide. For a likely genuine association, the centroid of the MST cluster shall become closer to the counterpart and the cluster shall remain usually stable for different choices of Λcut.
While one of these clusters (9Y-MST J0233+0656) has a much closer 3FHL counterpart, i.e. the more distant 3FGL association is very likely spurious, in three cases (9Y-MST J0009−1418, 9Y-MST J1202+3857, and 9Y-MST J1553−0305) the cluster remains at a wide or even increasing separation from the 3FGL counterpart for various choices of the surrounding field dimension and/or Λcut. We therefore discard these possible associations as spurious.
The MST cluster separation from the 3FGL sources decreases (down to a few arcmin) only in two cases: 9Y-MST J1336−4043 associated with 3FGL J1335.2−4056 and 9Y-MST J2127−3940 associated with 3FGL J2126.5−3926. Thus we retain these associations.
Finally, there are two 3FGL sources associated with 9Y-MST cluster pairs: 3FGL J1150.5+4155 and 3FGL J0843.4+6713. At a separation of 1ʹ̣48 from 3FGL J1150.5+4155, which has a well established counterpart in the bright BL Lac object 5BZB J1150+4154, there is the very rich cluster 9Y-MST J1150+4154 with 86 photons and Rmax= 18ʹ̣5 while the much smaller 9Y-MST J1150+4209 with only 4 photons and a low M = 17.27 is located at 15ʹ̣28. There are no interesting possible counterparts for the latter cluster, which can be reasonably considered as a satellite of the former. The other case is that of 3FGL J0843.4+6713, without any reported counterpart, which has two nearby clusters: 9Y-MST J0843+6713 (N = 10; M = 27.87) at the very small angular distance between the centroids of 8″ and 9Y-MST J0842+6656 (N = 9; M = 32.03, with δ = 17ʹ̣24) and a close 3FHL association. Such a large difference in angular separations and the low probability ratio that the associated cluster is more distant (≈6 × 10⁻⁵, estimated from the area ratio of the circles spanned by the two distances), indicates that the former is more likely associated with the 3FGL source.
4.4. 2FGL and 1FGL catalogues
A further search for associations within 18′ with the 2FGL catalogue (Nolan et al. 2012, two years of observations, 1024 sources in the sky region under investigation) and 1FGL catalogue (1FGL, 11 months of observations, 806 sources in the same sky region) revealed two further associations: 9Y-MST J0723+5840 associated with 1FGL J0722.3+5837 and 9Y-MST J0952+3931 associated with 1FGL J0952.2+392. The total number of clusters in the 9Y-MST associated with either 3FHL or 3FGL/2FGL/1FGL is thus equal to 1064, implying that 79.3% of the 9Y-MST sources have a counterpart in one of the Fermi-LAT catalogues.
5. Correspondence between 9Y-MST and other known γ-ray sources
As mentioned in the Introduction, in a series of four papers we applied MST for searching in the LAT sky candidate sources likely associated with blazars at energies higher than 10 GeV. In Paper I we searched in the 6.3 year LAT sky (Pass 7) for clusters that have possible counterparts among the BL Lac objects reported in the fifth edition of the Roma-BZCAT (Massaro et al. 2014, 2015) and found 19 clusters with 5 ≤ N ≤ 12 and 15.2 ≤ M ≤ 36.47. These sources were verified by means of the standard unbinned likelihood analysis that found 15 sources with TS ≥ 15, with 7 sources having TS ≥ 25.
In Papers II, III, and IV a similar analysis was performed on the seven year LAT sky (Pass 8) to search clusters that have an association with the 1WHSP sample (Arsioli et al. 2015), with blazars of different type in the Roma-BZCAT, and with new blazar candidates with mid-IR selection, such as WIBRaLS (D’Abrusco et al. 2014), respectively. These papers collectively reported 71 new clusters with M > 20, of which only 3 resulted with likelihood test statistics TS < 16, and with 58 having TS > 25. Furthermore, 67 of these 71 clusters were confirmed in the subsequent 3FHL catalogue.
In the 9Y-MST catalogue there are 73 clusters within an angular distance of 6′ out of these 90 previously MST-found blazars (Papers I–IV); 3 more clusters are at distances of ∼6ʹ̣5, but their Rmax is higher than 12′ and one also has a Rm as large as 8ʹ̣5: therefore, their associations cannot be excluded a priori. Of the remaining 14 non-associated clusters, 7 were reported in Paper I, 3 in Paper III, and 4 in Paper IV.
We verified whether some of these clusters were present in the lists produced with the primary selection and found 12 with M and g values lower than the strict thresholds considered for the superselection, although 8 of these had M > 15. Only two clusters, both in Paper I with low TS values (MST 0803+2440 and MST 1311+3951) were not confirmed by the present analysis. It is interesting that MST 1311+3951 is reported in the 3FHL (as 3FHL J1311.7+3954), together with another of these 14 MST blazars (MST 1449+2746 in Paper III, corresponding to 3FHL J1449.5+2745). Therefore, 1073 of the 1342 9Y-MST sources were previously reported in either one of the Fermi-LAT catalogues or in Papers I–IV.
Recently, Arsioli & Chang (2017) reported the results of a search for γ-ray emission from blazars and candidates listed in the 2WSHP sample (Chang et al. 2017) and detected a signal in the 0.3−500 GeV band from 150 objects (1BIGB sample) not reported in the 1FGL, 2FGL, and 3FGL catalogues. Twentyeight of the 1BIGB sources were in the previous lists found by MST analysis (Papers I–IV). Of the 150 1BIGB sources, 51 are also associated with 9Y-MST clusters within a distance of 6′. Of these, 26 out of 28 correspond to Paper I–IV sources, while the other two are below the selection threshold. After the subtraction of these sources we obtained a sample of 252 9Y-MST unassociated clusters.
Other three γ-ray sources were found to be associated with 9Y-MST clusters. One is the famous GRB 130427A (Maselli et al. 2014) clearly detected by Fermi-LAT (Ackermann et al. 2014) and corresponding to a cluster of 16 photons (M = 59.27) located at 2ʹ̣35 from the GRB position. The cluster 9Y-MST 2250−1255 is clearly associated with the flat spectrum radio source PKS 2247−131, without any known optical counterpart. This source had a γ-ray flare in 2016 detected by Fermi-LAT (Buson 2016) and the corresponding rich cluster has 25 photons (M = 94.27). The third cluster is 9Y-MST J1544−0649 with 22 photons and M = 96.6 corresponding to the transient source Fermi J1544−0649, which brightened for two consecutive weeks beginning on 2017 May 15 (Ciprini et al. 2017) and was later observed in other bands (Chornock & Margutti 2017; Kawase et al. 2017): this cluster was associated with the galaxy 2MASX J15441967−0649156, which exhibits some blazar properties.
Thus the final list of newly discovered clusters includes 249 objects and it is reported in Table A.1. Two of these sources are located in the LMC, which is a complex and interesting region. A discussion on the counterparts within this region is deferred to another paper (Campana et al. 2018).
The Fermi-LAT collaboration has published on-line a preliminary list of γ-ray sources detected in eight years of observation4. This FL8Y list will be superseded in the near future by a new official catalogue. This catalogue contains 5524 entries of which 2931 are at Galactic latitudes |b| > 20°. We verified how many 9Y-MST clusters have a positional correspondence with sources in this list and found 1177 matches within an angular distance of 8′, including all the correspondences with the 3FGL catalogue. Moreover, in this residual sample we found four 3FHL, one 1BIGB source, and the above reported GRB, reducing thus the number of unassociated clusters to 159. Thus, the percentage of clusters with a confirmed γ-ray counterpart can increase up to about 88%.
6. Particular cluster subsamples
In the full 9Y-MST catalogue there are 449 clusters characterized either by a low number of photons or by a low clustering factor; consequently these sources have values of M that are not high enough to exclude that a fraction of these clusters could not be associated with γ-ray sources, but instead correspond to spurious structures. In Sect. 3.4 we estimated that a percentage of 4% or slightly higher of the total number of catalogue sources is indeed expected to be not genuine. We also note that these subsamples contain about all unassociated clusters. In the following subsections we discuss the properties of these subsamples to achieve some specific indication of whether they are or not originated by random localized fluctuations of the photon density.
6.1. Low N clusters
There are 246 clusters that have less than 7 photons, of which 114 have 4 photons, 57 have 5 photons, and 75 have 6 photons. A large percentage of these clusters are associated with known γ-ray sources and for several others we found interesting possible counterparts to be confirmed by further investigations. Thus 46 clusters with 6 photons are associated with known γ-ray sources and 15 have candidate counterparts, 26 and 17 are those for the clusters with 5 photons and 33 and 30 are found among the 4 photon clusters. There are 82 low N clusters for which we did not find any association or any candidate counterpart, that is one-third of the entire subsample.
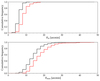 |
Fig. 9. Upper panel: cumulative distributions of Rm for the cluster samples with a photon number in the interval [7, 25] and g > 3 (black line) and g < 3 (red line). Lower panel: cumulative distributions of Rmax for the same two samples. |
6.2. Low g clusters
There are 203 clusters in the 9Y-MST catalogue with a value of the clustering degree g < 3.0 and a minimum number of 7 photons; two are in the Large Magellanic Cloud and are not included in the following analysis, reducing their effective number to 201. In principle, one can expect that this subsample might include a fraction of spurious clusters, not directly related to point-like sources but either to extended region of relatively high photon density, blended pairs of close sources, or single sources near some random concentrations of photons. As discussed in Sect. 3, the disentangling of these situations is not a simple task and a further MST analysis with a shorter Λcut in a rather small region surrounding the cluster under examination can provide useful information.
The values of Rm and Rmax of the low g clusters are systematically higher than those of other clusters with a similar photon number but g > 3. This is apparent from the cumulative distributions reported in Fig. 9. We note, however, that more than 60% of low g clusters have Rm < 8′, which is a value compatible with a point-like source; the large extension of clusters can be understood by the aggregation of a few photons of the local background due to the relatively long local separation length. The number of low g clusters in the residual sample of unassociated entries, after the selection for correspondences with known catalogues and lists (see the previous sections), is equal to 49, about 3.7% of the entire 9Y-MST catalogue and 24% of the subsample. For 14 of these clusters, particularly those with a low Rm, we found that they are located close to interesting radio sources and blazar candidates worthwhile of further investigations.
Other clusters, when analysed in a restricted field, dissolve into small non-significant structures, and therefore can be related to an increase of the local background instead of a genuine source. For example, in the case of the cluster 9Y-MST J0009−3249 of 12 photons and the very large Rmax = 37ʹ̣6, at the Galactic latitude b = −79°̣365 and at the angular distance of 4ʹ̣7 from a D3PO structure (Selig et al. 2015), we found that it disappears by applying a Λcut value just below that used in the primary selection.
7. Roma-BZCAT blazars in the 9Y-MST catalogue
Blazars of the two main types, i.e. BL Lac objects and flat spectrum radio quasars (FSRQ), are the richest class of high-energy γ-ray sources. For this reason, it is interesting to investigate which clusters in the full 9Y-MST catalogue have a well-established association with the known and candidate blazars in the fifth edition of the Roma-BZCAT. This catalogue contains 3561 radio detected AGNs divided into three main types: BL Lac objects, candidates, and galaxy-dominated blazars (BZB and BZG, 1428 sources), FSRQ (BZQ, 1909 sources), plus a rather small sample of sources of uncertain type (BZU, 224 sources). The search for counterparts with all the entries in the catalogues gave 726 associations within 6′ and 738 associations within 8′, 7 of which are double associations and are discussed at the end of this section. The mean angular separaton is 〈δ〉 = 1ʹ̣65, that is much lower than the PSF radius at these energies, confirming the good estimates of the centroid coordinates given by our method. Only 12 sources were found with 6′ < δ < 8′, but for 10 of these sources their Rmax were from ∼25% to more than 3 times larger than δ; thus these associations cannot be excluded.
Two clusters (9Y-MST J2231−4422 and 9Y-MST J2358−4602) are located at δ values from the candidate counterparts comparable or larger than their Rmax, thus the possibility that they were spurious association due to random closeness must be taken into account. Moreover, these two clusters have 3FGL sources at δ values of 5ʹ̣6 and 10ʹ̣5, respectively.
To verify the possibility of spurious associations we also searched for counterparts that have an angular distance to the cluster centroid higher than the corresponding Rmax. In the sample of 738 associated blazars, only 3 did not satisfy this criterion: one is 9Y-MST J2358−4602, reported above, and the other two are 2 clusters of only 4 photons, very high clustering factors and Rmax lower than 4′. There is no statistical tool to establish if the associations of these two clusters were spurious or not, but considering that they were found to be positionally associated with FL8Y sources the most likely indication is for a genuine result.
The large majority of blazars related to γ-ray clusters are already in the 3FGL and 3FHL catalogues, while there are 34 associations with newly discovered 9Y-MST clusters with δ < 6′, however 12 are already in the 1BIGB sample. Thus, our new detections of known blazars above 10 GeV are 22.
Finally, our results confirm that the richest class of high-energy γ-ray emitters are BL Lac objects with 548 sources, i.e. a percentage of about the 74% of the total sample, while FSRQs are 155 (∼21%) and 35 (∼4%) belong to those with uncertain classification. This finding is even more relevant in the subsample of Table A.1, in which there are 16 BL Lac objects that are counterpart candidates of which another 4 galaxy-dominated candidates must be added, while there are only 3 clusters with a possible association to FSRQ.
As reported above, we found that seven 9Y-MST clusters can be associated with a pair of fifth Roma-BZCAT sources within the angular distance of 8′. These rare cases can be due either to a single genuine association with a source in proximity of another blazar or to a real confusion if both sources are γ-ray loud.
To discriminate between these two possibilities we performed a new MST analysis in small regions surrounding these clusters to verify if they are fragmented into more components when lower Λcut values are used. For five of the seven clusters with a double blazar association, even performing a cluster search with Λcut values as low as 0.2 Λm, we always obtained single clusters with Rm and Rmax smaller enough to exclude the more distant blazar as a counterpart. The source confusion only remains in the two cases of 9Y-MST J0009+0627 and 9Y-MST J0442−0019 because the possible counterparts are found to be very close to the cluster centroids even with the shortest Λcut values. More precisely, the former cluster with Rm = 3ʹ̣1 and Rmax= 10ʹ̣2 has two blazars, 5BZQ J0009+0625 and 5BZB J0009+0628, at δ equal to 2ʹ̣1 and 2ʹ̣6, respectively, and the latter (Rm = 6ʹ̣1, Rmax= 20ʹ̣6) has 5BZB J0323−0111 and 5BZB J0323−0108 at 1ʹ̣5 and 5ʹ̣6, respectively.
8. High-energy unassociated clusters
As reported in Sect. 5, after having removed the clusters corresponding to the high-energy associations discussed in the preceding Sections, we obtained 249 clusters not corresponding to any source in the published Fermi catalogues or in the LMC (but including 89 new sources in the preliminary FL8Y list).
We also searched for positional correspondences between these clusters and objects in catalogues of possible blazars selected on the basis of the occurrence of some features typical of this class of active galactic nuclei (AGNs). The catalogues used were CRATES (Healey et al. 2007), which reports 11,131 flat spectrum radio sources; WIBRaLS (WISE Blazarlike Radio-loud Sources; D’Abrusco et al. 2014), which lists 7855 sources with mid-infrared colours typical of blazars; and 2WHSP (Chang et al. 2017), a multi-frequency catalogue of 1691 high-energy and very high-energy γ-ray blazars and blazar candidates. Considering that in all the three catalogues the source coordinates are known with a high accuracy, we considered angular distances lower than 6′ for possible associations with γ-ray clusters, which agrees with the angular distance distribution given in Fig. 7. The 22 BZCAT objects already found in the previous search were excluded to avoid redundant associations (Sect. 7).
The resulting associations were 15 clusters with CRATES sources, 14 with WIBRaLS, and 15 with 2WHSP, but some are common to two or to all three samples. The final number of clusters associated with entries of any of these three catalogues is 28 and they are indicated by a specific note in Table A.1
The nature of the remaining unassociated clusters can be somewhat complex and several effects must be taken into account. As discussed in Sect. 3.3, there are several clusters that have values of Rm and Rmax in excess with respect to those generally found for clusters associated with point-like sources. In Table A.1, large size clusters likely corresponding with extended structure are indicated by “ex”. When investigated in rather small regions and with decreasing separation lengths, several clusters have an inner compact structure with radial values in agreement with those typical for clusters with a comparable photon number. We indicate these with the note “cc+ex”. In the same analysis other clusters dissolve in non-significant structures and likely should be considered spurious, and for this reason they have the annotation “sp”.
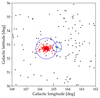 |
Fig. 10. Photon map at energies higher than 10 GeV in the sky region around the bright BL Lac object 1ES 1011+496. Photons in the rich cluster corresponding to the source are reported in red, while the green points are the 8 photons in the cluster 9Y-MST J1016+4949, likely a satellite of the former. Crosses indicate the centroid positions and the radii of the circles represent their Rmax. |
Another interesting possibility is the occurrence of possible satellite clusters, i.e. rather small clusters found at a relatively short distance from a much richer cluster. In principle, the nodes (i.e. the photon arrival directions) might belong to a unique cluster, but they were partitioned in two because of the occurrence of only one edge slightly longer than the separation distance. A satellite cluster usually has a g value and a photon number much lower that those of the nearby main cluster. Other possibilities are the occurrence of an extended emission, or of a single weak cluster embedded in a relatively high photon density region, and of a pair of close weak clusters.
We searched for satellites applying the simple criterion of sorting all cluster pairs having an angular separation of their centroids lower than the sum of their Rmax. Close weak clusters are expected to be resolved by a local MST analysis with a shorter Λcut, while an extended emission would preferably fragment into a few low significance features.
The results of this search include two triplets, one of which (already mentioned above) in the region of the Large Magellanic Cloud. The second triplet is in the environment of the rich cluster 9Y-MST J1512−0906 (343 photons) associated with a 3FGL/3FHL source and with the bright FSRQ PKS 1510−089. The two other clusters are 9Y-MST J1508−0904, an unassociated low g cluster (thus a reliable satellite candidate), and the much more distant 9Y-MST J1514−0948, close to a 3FHL source and to one of the previously detected MST blazars (Paper III). We found 9 pairs of poor clusters close to much richer clusters, 8 of which are unassociated. An example is shown in Fig. 10, in which the photons in a rather small sky region around the BL Lac object 1ES 1011+496 and the two MST-found clusters are plotted: the richer cluster (370 photons) is that associated with the blazar, while a much smaller unassociated cluster is found within the Rmax distance.
The rich cluster 9Y-MST J2139−4235 with 107 photons and Rmax= 39ʹ̣5 has the companion 9Y-MST J2138−4312 at 38ʹ̣2. The latter appears to be a significant structure (N = 8 and M = 30.08) instead of a satellite; moreover, it is at 4ʹ̣4 to a X-ray loud AGN with blazar mid-IR colours, enforcing this conclusion.
There are also 6 pairs with both clusters well associated with already known γ-ray sources. These cases must be considered as resolved with the Λcut employed. The 4 remaining pairs have unassociated clusters with a rather low number of photons: their classification as satellites is therefore uncertain because the occurrence of extended regions or of low significance close features cannot be excluded.
9. Summary and discussion
We analysed the first 9 years of Fermi-LAT data, using the Pass 8 events at energies higher than 10 GeV by means of the MST algorithm for detecting photon clusters. In the selection procedure we adopted severe threshold values to reduce the possibility of spurious detections due to local background fluctuations. We limited our search to the Galactic regions with |b| > 20° to avoid confusion problems in the Galactic belt due to its high photon density, which makes the choice of the best separation length difficult.
A new catalogue of 1342 clusters was obtained. The large majority of these clusters have a close spatial correspondence with γ-ray sources reported in the Fermi collaboration catalogues, but new γ-ray sources are detected through different multiwavelength searches and some others are found in the more recent preliminary FL8Y list. With respect to the 3FHL catalogue, which has 986 sources in the regions with a Galactic latitude higher than 20°, the number of 9Y-MST clusters is increased by about 36%. The sample of new detections contains 249 entries and is reported in Table A.1. Of these, 89 are also in the FL8Y list, thus there is a residual sample of 160 new γ-ray clusters. The search in catalogues of objects dominated by non-thermal emission in different electromagnetic bands gave 46 possible associations. We also searched for new possible blazar candidates within a region centred at the cluster centroid coordinates and having a radius of 6′. The search was based on possible optical or IR counterparts of radio sources, when present, or of quasars or candidates reported in large databases. Thus, 53 candidate objects were selected, whose blazar nature cannot be considered as confirmed since optical spectra are generally not available and in some cases there are no radio detections because their flux densities could be lower than the survey limits. A more detailed analysis of these objects will be presented in a forthcoming paper. Ultimately, there are 62 clusters without any confirmed or possible counterpart (of which 19 are classified as possible satellites or spurious clusters) i.e. less than 5% of the catalogue. This figure confirms the efficiency of the method and selection criteria.
As known from other high-energy catalogues, the large majority of clusters is associated with blazars and particularly with BL Lac objects (see Sect. 7). The continuous observation of the entire sky by Fermi-LAT over period of about a decade can enrich our knowledge of the population properties of this class of AGNs. It can be expected that the study of faint γ-ray sources can lead to the discovery of semi-quiescent or rarely flaring blazars, i.e. galactic nuclei exhibiting only occasionally bright high-energy bursts and remaining for rather long times in states too faint to allow their inclusion in sample based on a few “shot-like” measurements.
Acknowledgments
We acknowledge use of archival Fermi data. We made large use of the on-line version of the Roma-BZCAT and the scientific tools developed at the ASI Science Data Center (ASDC), the final release of 6dFGS archive, the Sloan Digital Sky Survey (SDSS) archive, the NED database, and other astronomical catalogues distributed in digital form (Vizier and Simbad) at Centre de Dates astronomiques de Strasbourg (CDS) at the Louis Pasteur University.
The catalogue is also available at the URL: http://www.iasfbo.inaf.it/
Appendix A: Additional table
Sources in the 9Y-MST catalogue unassociated with any Fermi-LAT catalogue.
References
- Abdo, A. A., Ackermann, M., Ajello, M., et al. 2010, ApJS, 188, 405 [NASA ADS] [CrossRef] [Google Scholar]
- Acero, F., Ackermann, M., Ajello, M., et al. 2015, ApJS, 218, 23 [Google Scholar]
- Ackermann, M., Ajello, M., Albert, A., et al. 2012, ApJS, 203, 4 [NASA ADS] [CrossRef] [Google Scholar]
- Ackermann, M., Ajello, M., Allafort, A., et al. 2013a, ApJ, 765, 54 [NASA ADS] [CrossRef] [Google Scholar]
- Ackermann, M., Ajello, M., Allafort, A., et al. 2013b, ApJS, 209, 34 [NASA ADS] [CrossRef] [Google Scholar]
- Ackermann, M., Ajello, M., Asano, K., et al. 2014, Science, 343, 42 [NASA ADS] [CrossRef] [PubMed] [Google Scholar]
- Ajello, M., Atwood, W. B., Baldini, L., et al. 2017, ApJS, 232, 18 [NASA ADS] [CrossRef] [Google Scholar]
- Armstrong, T., Brown, A. M., Chadwick, P. M., & Nolan, S. J. 2015, MNRAS, 452, 3159 [NASA ADS] [CrossRef] [Google Scholar]
- Arsioli, B., & Chang, Y.-L. 2017, A&A, 598, A134 [NASA ADS] [CrossRef] [EDP Sciences] [Google Scholar]
- Arsioli, B., Fraga, B., Giommi, P., Padovani, P., & Marrese, P. M. 2015, A&A, 579, A34 [NASA ADS] [CrossRef] [EDP Sciences] [Google Scholar]
- Asvathaman, A., Omand, C., Barton, A., & Heyl, J. S. 2017, MNRAS, 466, 2378 [NASA ADS] [CrossRef] [Google Scholar]
- Bignami, G. F., Boella, G., Burger, J. J., et al. 1975, Space Sci. Instrum., 1, 245 [NASA ADS] [Google Scholar]
- Buson, S. 2016, ATel, 9285 [Google Scholar]
- Campana, R., Massaro, E., Gasparrini, D., Cutini, S., & Tramacere, A. 2008, MNRAS, 383, 1166 [NASA ADS] [CrossRef] [Google Scholar]
- Campana, R., Bernieri, E., Massaro, E., Tinebra, F., & Tosti, G. 2013, Ap&SS, 347, 169 [NASA ADS] [CrossRef] [Google Scholar]
- Campana, R., Massaro, E., Bernieri, E., & D’Amato, Q. 2015, Ap&SS, 360, 19 [CrossRef] [Google Scholar]
- Campana, R., Massaro, E., & Bernieri, E. 2016a, Ap&SS, 361, 367 [NASA ADS] [CrossRef] [Google Scholar]
- Campana, R., Massaro, E., & Bernieri, E. 2016b, Ap&SS, 361, 185 [NASA ADS] [CrossRef] [Google Scholar]
- Campana, R., Massaro, E., & Bernieri, E. 2016c, Ap&SS, 361, 183 [NASA ADS] [CrossRef] [Google Scholar]
- Campana, R., Massaro, E., & Bernieri, E. 2018, Ap&SS, 363, 144 [NASA ADS] [CrossRef] [Google Scholar]
- Chang, Y.-L., Arsioli, B., Giommi, P., & Padovani, P. 2017, A&A, 598, A17 [NASA ADS] [CrossRef] [EDP Sciences] [Google Scholar]
- Chornock, R., & Margutti, R. 2017, ATel, 10491 [Google Scholar]
- Ciprini, S., Tosti, G., Marcucci, F., et al. 2007, in The First GLAST Symposium, eds. Ritz, S. Michelson, P. & Meegan, C. A., AIP Conf. Ser., 921, 547 [NASA ADS] [Google Scholar]
- Ciprini, S., Cheung, C. C., Kocevski, D., et al. 2017, ATel, 10482 [Google Scholar]
- D’Abrusco, R., Massaro, F., Paggi, A., et al. 2014, ApJS, 215, 14 [NASA ADS] [CrossRef] [Google Scholar]
- Damiani, F., Maggio, A., Micela, G., & Sciortino, S. 1997, ApJ, 483, 350 [NASA ADS] [CrossRef] [Google Scholar]
- Di Gesù, V., & Sacco, B. 1983, Pattern Recognit., 16, 525 [CrossRef] [Google Scholar]
- Healey, S. E., Romani, R. W., Taylor, G. B., et al. 2007, ApJS, 171, 61 [NASA ADS] [CrossRef] [Google Scholar]
- Kawase, T., Negoro, H., Ueno, S. et al. 2017, ATel, 10495 [Google Scholar]
- Maselli, A., Melandri, A., Nava, L., et al. 2014, Science, 343, 48 [NASA ADS] [CrossRef] [Google Scholar]
- Massaro, E., Maselli, A., Leto, C., et al. 2014, in Multifrequency Catalogue of Blazars, 5th ed. (Rome: Aracne Editrice) [Google Scholar]
- Massaro, E., Maselli, A., Leto, C., et al. 2015, Ap&SS, 357, 75 [NASA ADS] [CrossRef] [Google Scholar]
- Mattox, J. R., Bertsch, D. L., Chiang, J., et al. 1996, ApJ, 461, 396 [NASA ADS] [CrossRef] [Google Scholar]
- Nolan, P. L., Abdo, A. A., Ackermann, M., et al. 2012, ApJS, 199, 31 [NASA ADS] [CrossRef] [Google Scholar]
- Prim, R. 1957, Bell System Tech. J., 36, 1389 [Google Scholar]
- Selig, M., Vacca, V., Oppermann, N., & Enßlin, T. A. 2015, A&A, 581, A126 [NASA ADS] [CrossRef] [EDP Sciences] [Google Scholar]
- Su, M., Slatyer, T. R., & Finkbeiner, D. P. 2010, ApJ, 724, 1044 [NASA ADS] [CrossRef] [Google Scholar]
- Tramacere, A., & Vecchio, C. 2013, A&A, 549, A138 [NASA ADS] [CrossRef] [EDP Sciences] [Google Scholar]
All Tables
Summary of the main parameters in the MST source detection algorithm and their meaning.
All Figures
|
Fig. 1. Sky map of the Fermi-LAT exposure at 10 GeV in the first 9 years of observation in scanning mode. |
| In the text | |
|
Fig. 2. Sky map of the photons in the 10–300 GeV energy range considered in our analysis. Green lines indicate the boundaries of the regions used for the MST cluster search. Red dots are the clusters given in the final 9Y-MST catalogue. |
| In the text | |
|
Fig. 3. Upper panel: cumulative distributions of the magnitude M of the clusters after the primary (red) and secondary (blue) selections. Vertical bars correspond to the cuts M > 15.0 and M > 20.0. Lower panel: cumulative distributions of the clustering parameter g of the same cluster sets. Vertical bar corresponds to the selection thresholds g > 3.0 and g > 3.5. |
| In the text | |
|
Fig. 4. Distribution of the N, g, and M parameters for all the 9Y-MST sources (blue histograms) and for the unassociated sources only (red histograms, see main text for details). |
| In the text | |
|
Fig. 5. Distributions of Rmax(black histogram) and Rm(red histogram) for all the 9Y-MST sources. Nearly all clusters have Rm values smaller than 8′, while the other distribution is peaked around 10′. |
| In the text | |
|
Fig. 6. Scatter plots of the maximum radius Rmax (black points) and of the mean radius Rm (red points) vs. the number of photons in the clusters for all the 9Y-MST sources. We note that for high photon number the mean radius is very close the constant value of 4ʹ̣5 (horizontal line). Green crosses overlaid on the black points indicate the 3FGL counterparts to the 9Y-MST clusters. |
| In the text | |
|
Fig. 7. Histograms of the angular distances δ between the clusters in the 9Y-MST catalogue and the sources in the 3FHL (red) and 3FGL (black) catalogues. The dashed vertical line indicates the matching distance of 6′ assumed for the 3FHL associations. |
| In the text | |
|
Fig. 8. Number of photons N for the 9Y-MST clusters with a 3FHL counterpart vs. the number of ML predicted photons Npred. The red line is the linear best fit. |
| In the text | |
|
Fig. 9. Upper panel: cumulative distributions of Rm for the cluster samples with a photon number in the interval [7, 25] and g > 3 (black line) and g < 3 (red line). Lower panel: cumulative distributions of Rmax for the same two samples. |
| In the text | |
|
Fig. 10. Photon map at energies higher than 10 GeV in the sky region around the bright BL Lac object 1ES 1011+496. Photons in the rich cluster corresponding to the source are reported in red, while the green points are the 8 photons in the cluster 9Y-MST J1016+4949, likely a satellite of the former. Crosses indicate the centroid positions and the radii of the circles represent their Rmax. |
| In the text | |
Current usage metrics show cumulative count of Article Views (full-text article views including HTML views, PDF and ePub downloads, according to the available data) and Abstracts Views on Vision4Press platform.
Data correspond to usage on the plateform after 2015. The current usage metrics is available 48-96 hours after online publication and is updated daily on week days.
Initial download of the metrics may take a while.