Fig. 6.
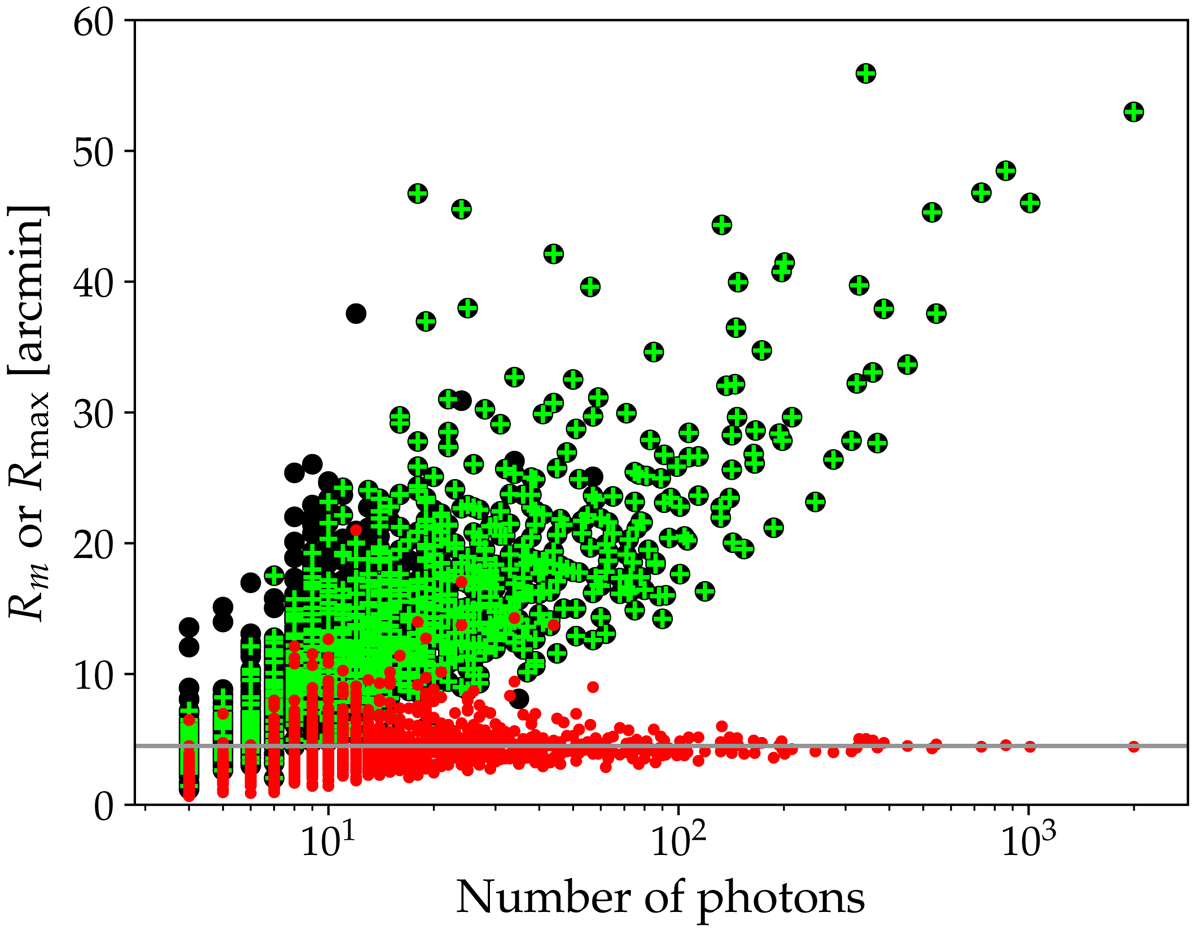
Scatter plots of the maximum radius Rmax (black points) and of the mean radius Rm (red points) vs. the number of photons in the clusters for all the 9Y-MST sources. We note that for high photon number the mean radius is very close the constant value of 4ʹ̣5 (horizontal line). Green crosses overlaid on the black points indicate the 3FGL counterparts to the 9Y-MST clusters.
Current usage metrics show cumulative count of Article Views (full-text article views including HTML views, PDF and ePub downloads, according to the available data) and Abstracts Views on Vision4Press platform.
Data correspond to usage on the plateform after 2015. The current usage metrics is available 48-96 hours after online publication and is updated daily on week days.
Initial download of the metrics may take a while.