Free Access
Fig. 7.
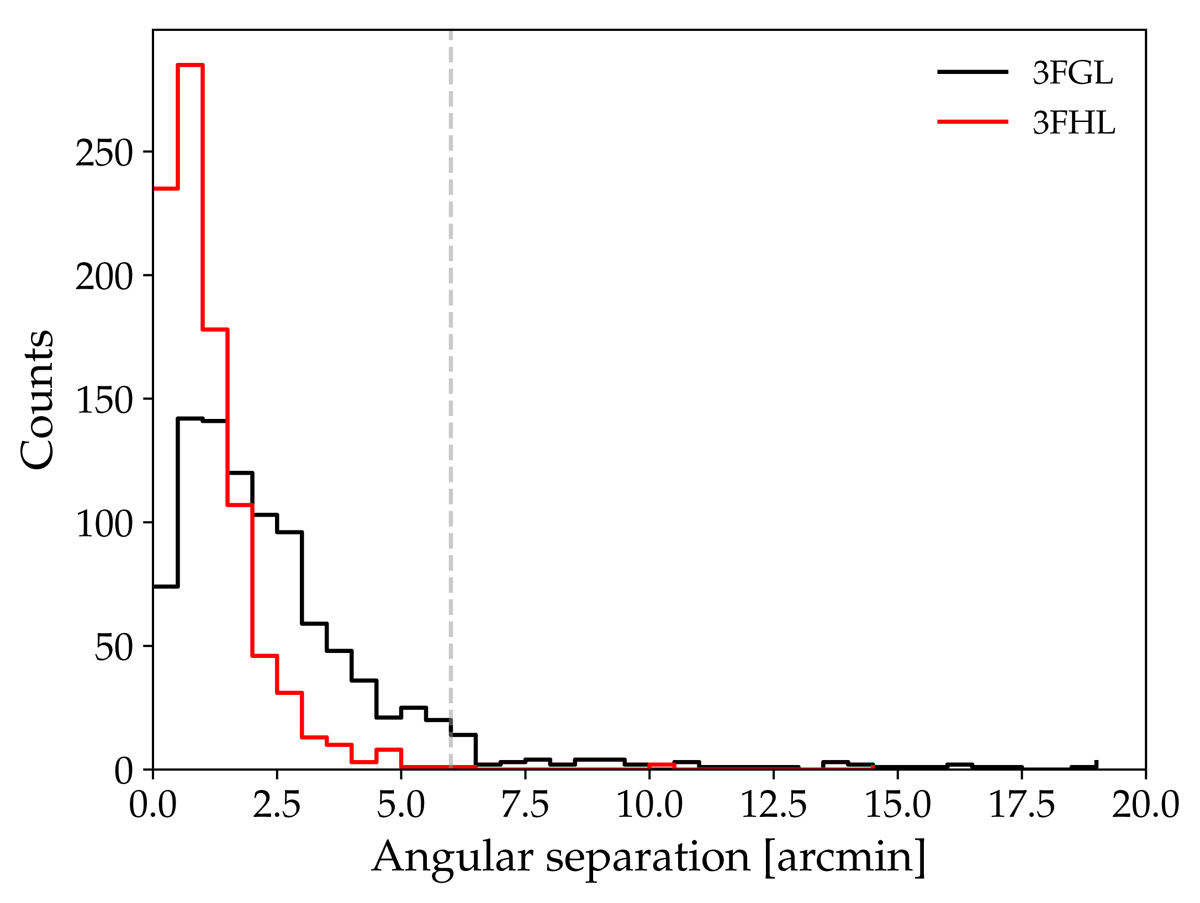
Histograms of the angular distances δ between the clusters in the 9Y-MST catalogue and the sources in the 3FHL (red) and 3FGL (black) catalogues. The dashed vertical line indicates the matching distance of 6′ assumed for the 3FHL associations.
Current usage metrics show cumulative count of Article Views (full-text article views including HTML views, PDF and ePub downloads, according to the available data) and Abstracts Views on Vision4Press platform.
Data correspond to usage on the plateform after 2015. The current usage metrics is available 48-96 hours after online publication and is updated daily on week days.
Initial download of the metrics may take a while.