Fig. 6.
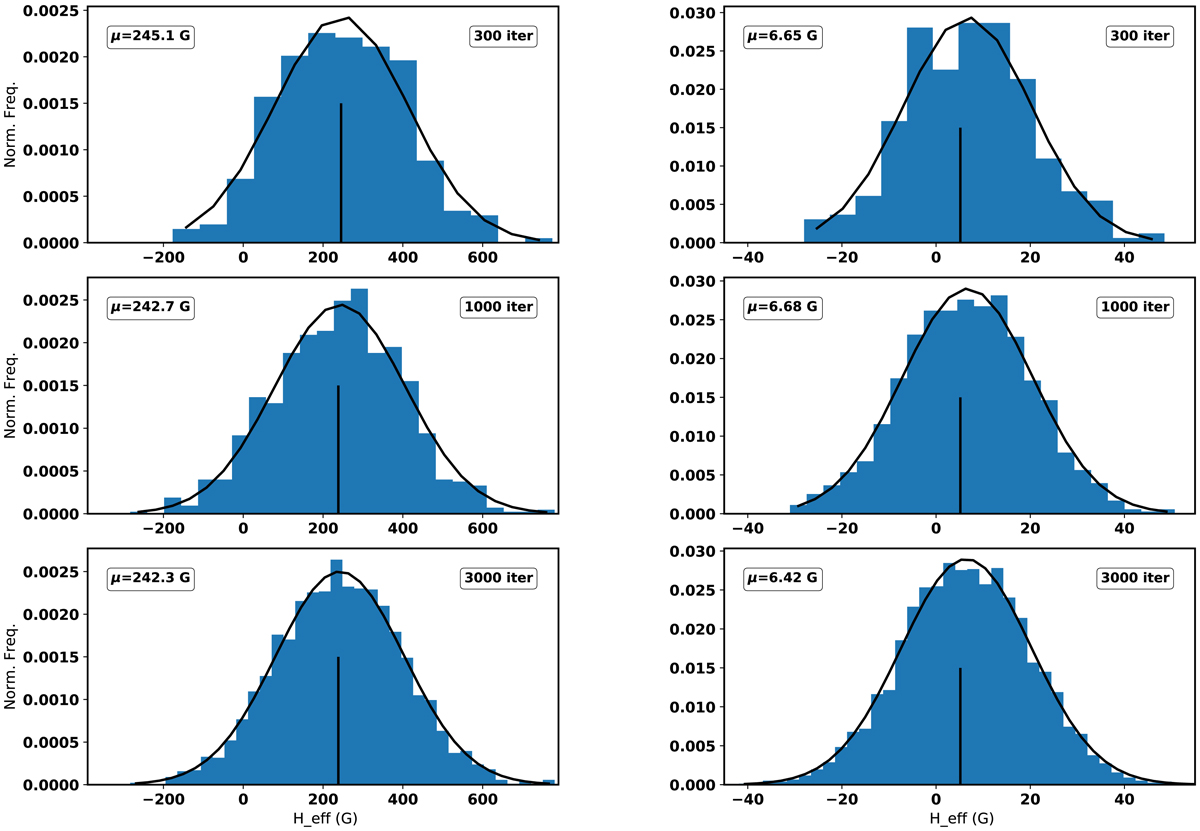
Two examples of the iterative inversion process; the original values of Heff are 238.2G (left panels) and 5.2G (right panels). Each histogram shows the inversion distributions considering different numbers of iterations (indicated in the upper right corner). The upper left legend in each histogram indicates the centroid of the fitted normal Gaussian distribution, which would correspond to the inferred value of Heff in each case.
Current usage metrics show cumulative count of Article Views (full-text article views including HTML views, PDF and ePub downloads, according to the available data) and Abstracts Views on Vision4Press platform.
Data correspond to usage on the plateform after 2015. The current usage metrics is available 48-96 hours after online publication and is updated daily on week days.
Initial download of the metrics may take a while.