Fig. 2.
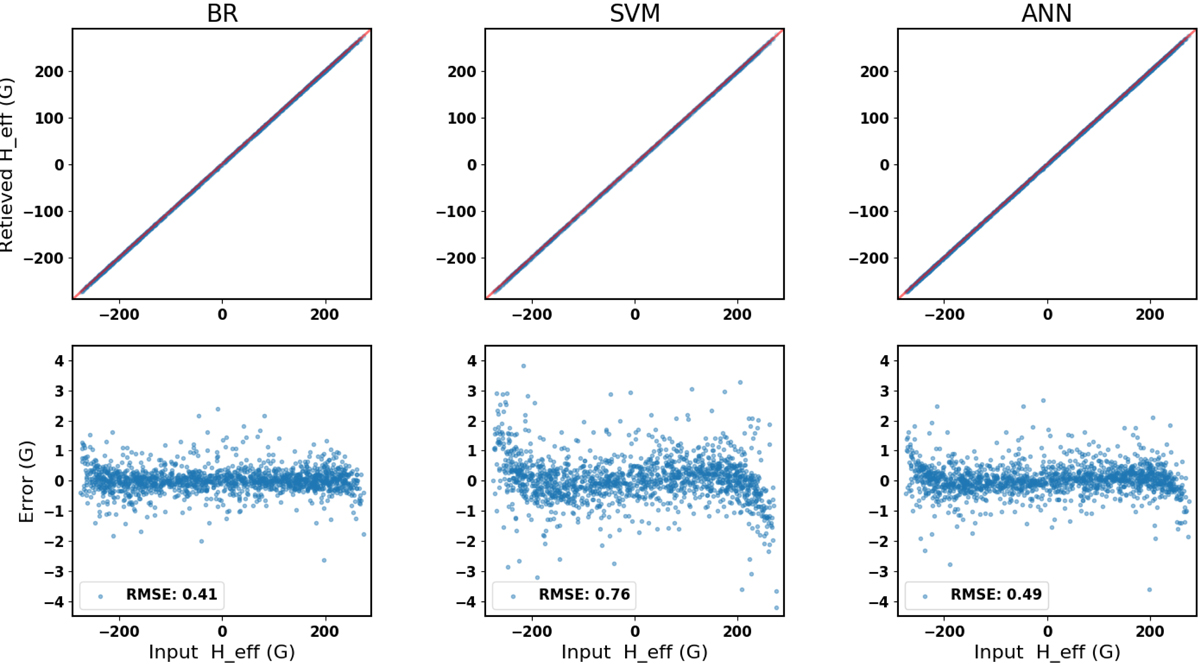
Performance of the regression models when 300 MZSs were considered during the training process. The X axis for all panels corresponds to the original value of Heff for each of the 1500 MZSs. In the upper panels the Y axis represents the predicted values of the inversions, while in the lower panel it corresponds to the inversion errors in units of Gauss. The red line in the upper panels represents a one-to-one relation.
Current usage metrics show cumulative count of Article Views (full-text article views including HTML views, PDF and ePub downloads, according to the available data) and Abstracts Views on Vision4Press platform.
Data correspond to usage on the plateform after 2015. The current usage metrics is available 48-96 hours after online publication and is updated daily on week days.
Initial download of the metrics may take a while.