Fig. 9
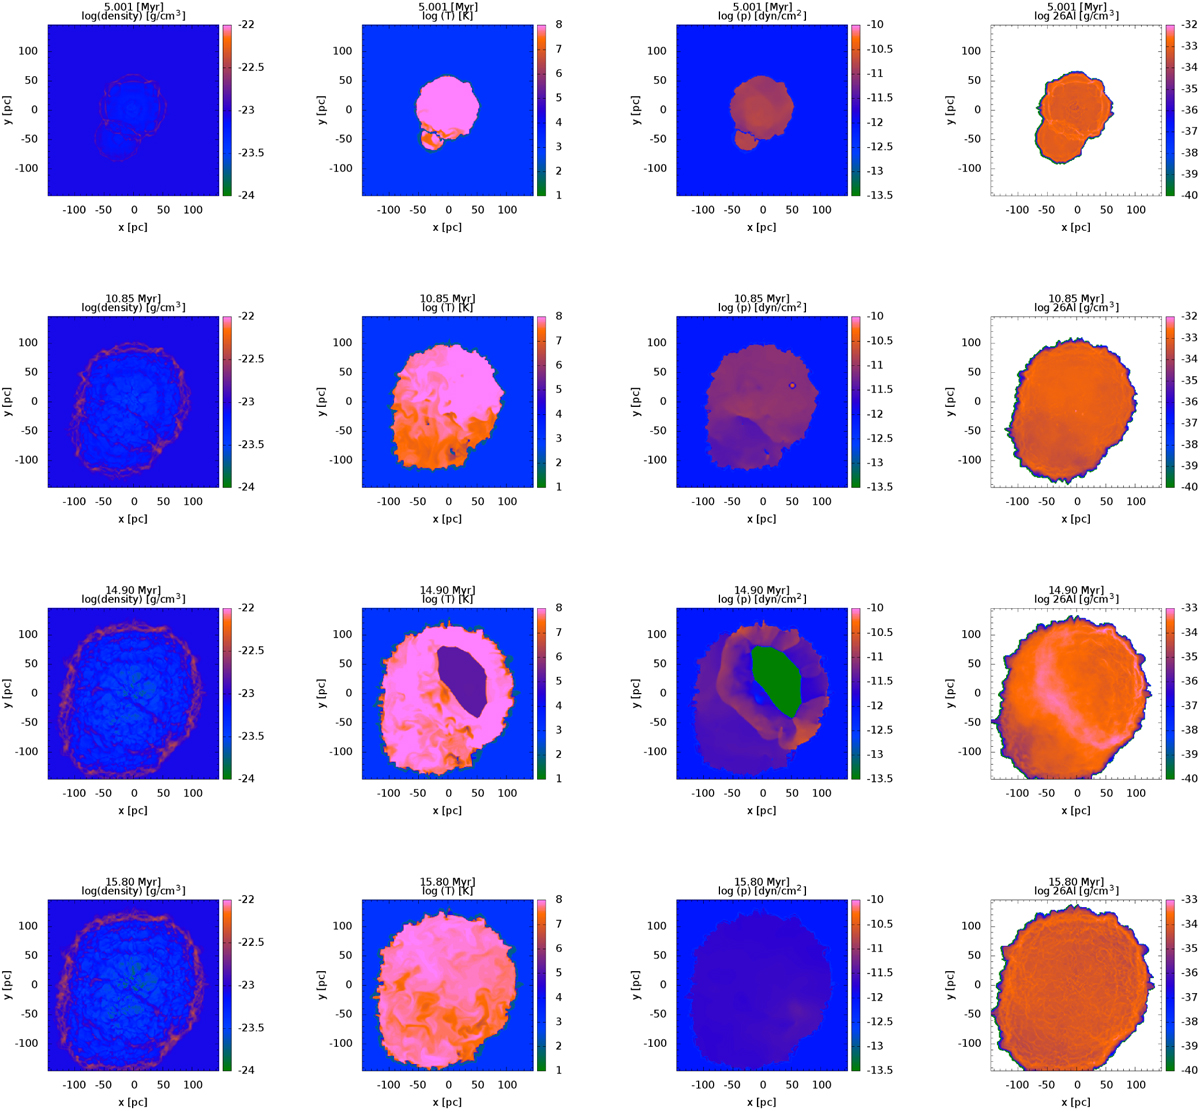
Time evolution of the 3D hydrodynamics simulation of the Sco–Cen superbubble in a homogeneous environment. Columns from left to right: sight line-averaged logarithmic gas density, logarithmic temperature in the midplane, pressure in the midplane, and current, sight line-averaged mass density in 26Al, all in cgs units. UCL is initiated at time = 0 in the centre of the computational domain. LCC is formed at 2 Myr outside the UCL bubble, towards its lower left. At 5 Myr, the interface between the individual bubbles is eroding (top row). USco forms inside the UCL–LCC superbubble towards the upper right at 10 Myr. The expanding wind of its 60 M⊙ star is easily identified in the pressure plot at 10.85 Myr (second row). The overall pressure in the superbubble is high at this time due to two supernovae in UCL exploding at 10.48 Myr and one in LCC at 10.61 Myr. The massive star in USco explodes at 14.86 Myr. At 14.90 Myr (third row), it pressurises the superbubble again via an 26Al-rich shockwave. At the end of the simulation (15.80 Myr, bottom row, representing the present epoch), 26Al is uniformlydistributed throughout the superbubble. The pressure is low, but the temperature is still high enough to expect X-ray emission throughout the superbubble.
Current usage metrics show cumulative count of Article Views (full-text article views including HTML views, PDF and ePub downloads, according to the available data) and Abstracts Views on Vision4Press platform.
Data correspond to usage on the plateform after 2015. The current usage metrics is available 48-96 hours after online publication and is updated daily on week days.
Initial download of the metrics may take a while.