Fig. 6
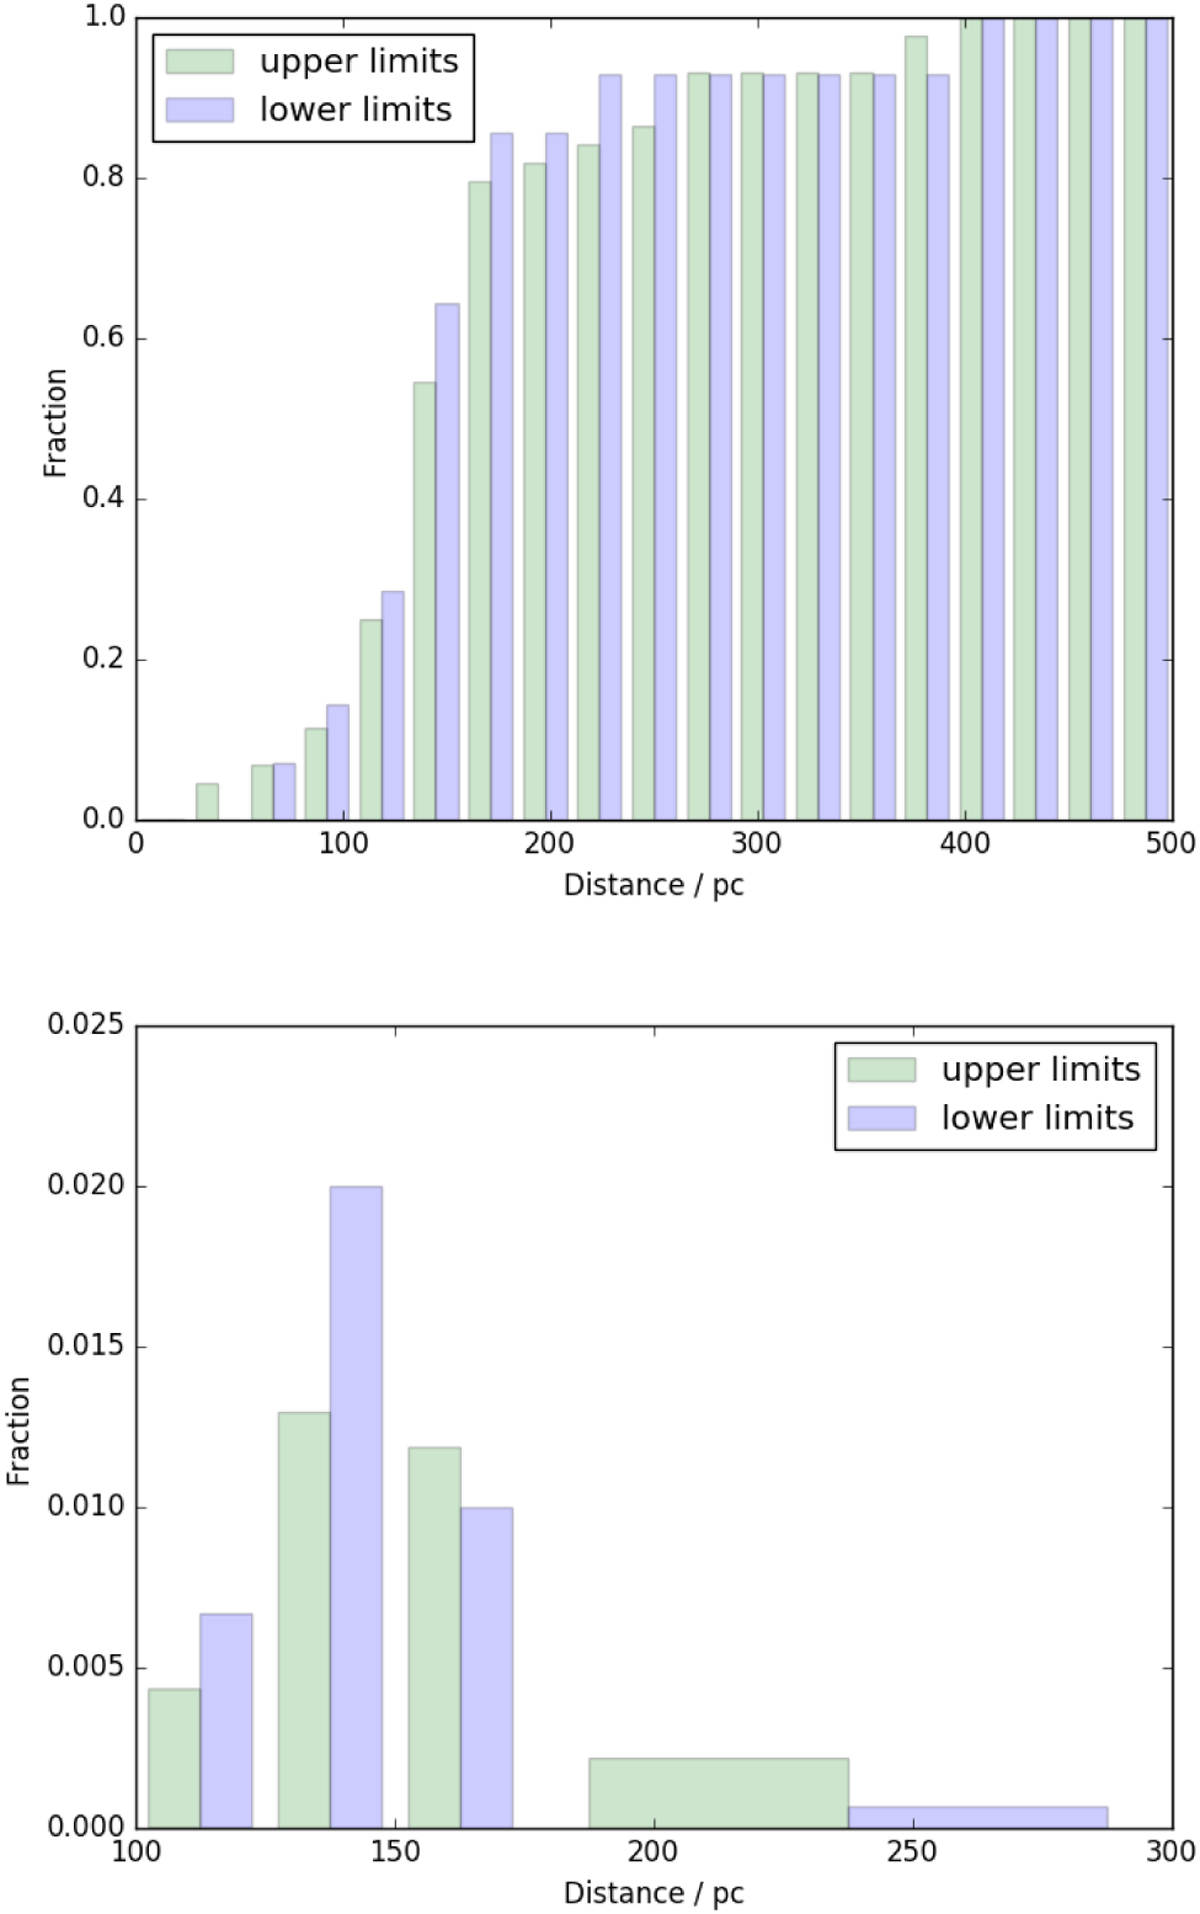
Histograms of distances of HI features in Sco–Cen determined by association with Nai absorption lines. Top panel: cumulative histogram for all available stars. Bottom panel: histogram from stars at distances between 100 and 300 pc. More lower (upper) limits are found up to (above) about 150 pc; almost no lower limits are found above 220 pc.
Current usage metrics show cumulative count of Article Views (full-text article views including HTML views, PDF and ePub downloads, according to the available data) and Abstracts Views on Vision4Press platform.
Data correspond to usage on the plateform after 2015. The current usage metrics is available 48-96 hours after online publication and is updated daily on week days.
Initial download of the metrics may take a while.