Fig. 5
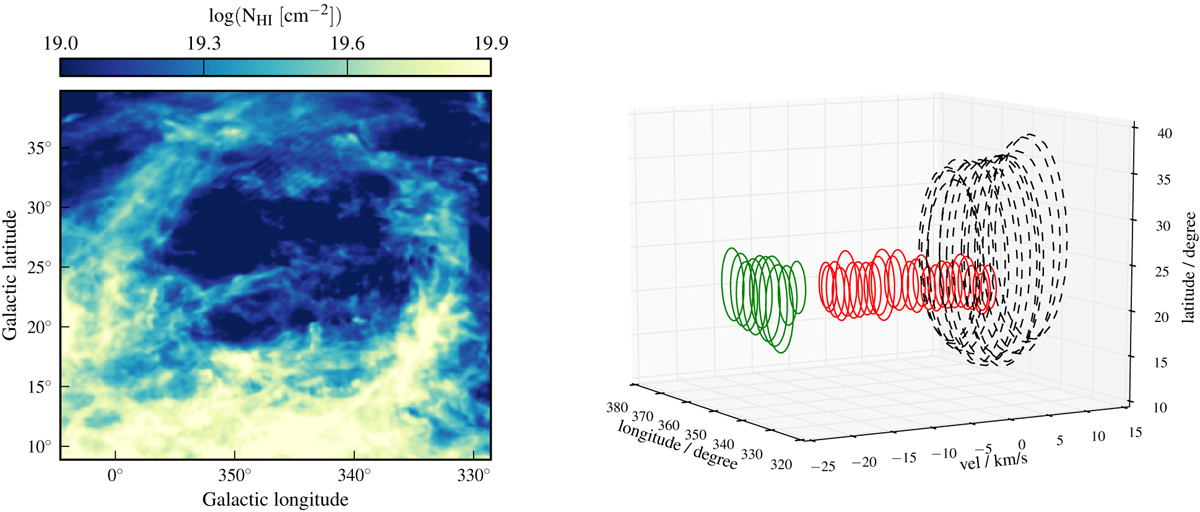
Intensity of the 21 cm line of neutral hydrogen towards USco in the 7.4 km s−1 velocity channel (left panel) and by-eye characterisation of the Hi structures across multiple velocity channels (right panel). Three groups of rings are apparent: the USco loop (black), which corresponds to the dominant loop in the channel map on theleft, and two smaller, tube-like structures (green and red) which are cospatial but separated in velocity space. The red and green rings might be a result of erosion of the Hi interface between the Sco–Cen superbubble and the local bubble, where the hot gas streaming through the hole ablates and accelerates the Hi.
Current usage metrics show cumulative count of Article Views (full-text article views including HTML views, PDF and ePub downloads, according to the available data) and Abstracts Views on Vision4Press platform.
Data correspond to usage on the plateform after 2015. The current usage metrics is available 48-96 hours after online publication and is updated daily on week days.
Initial download of the metrics may take a while.