Fig. 4
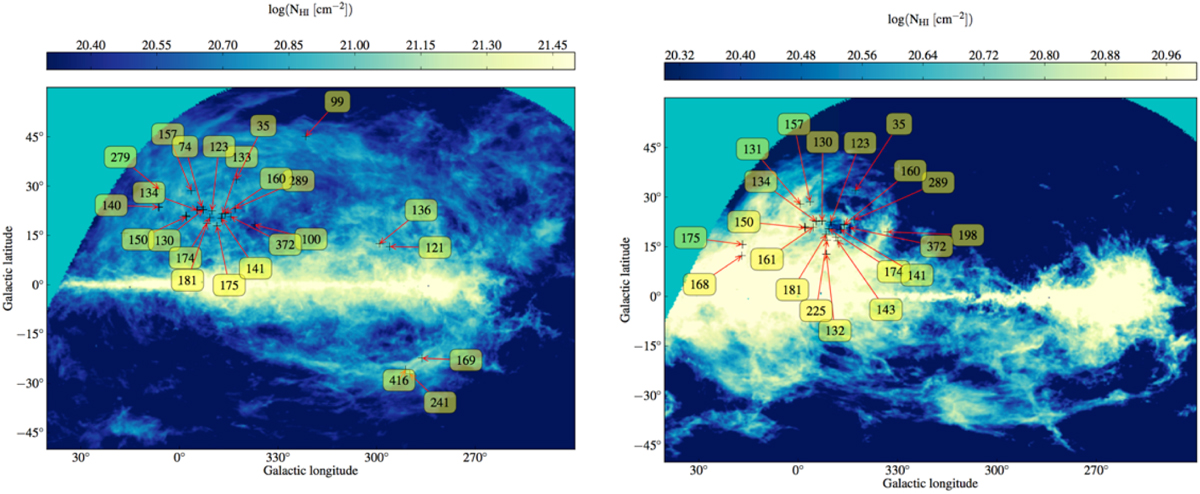
Intensity of the 21 cm line of neutral hydrogen towards Sco–Cen. Left (right) panel: emission integrated between −20 and 0 km s−1 (0 and 10 km s−1). The numbers in the yellow boxes show upper distance limits for the Hi features derived from velocity-matched Nai absorption lines against stars with distances known from parallax measurements by Hipparcos and Gaia.
Current usage metrics show cumulative count of Article Views (full-text article views including HTML views, PDF and ePub downloads, according to the available data) and Abstracts Views on Vision4Press platform.
Data correspond to usage on the plateform after 2015. The current usage metrics is available 48-96 hours after online publication and is updated daily on week days.
Initial download of the metrics may take a while.