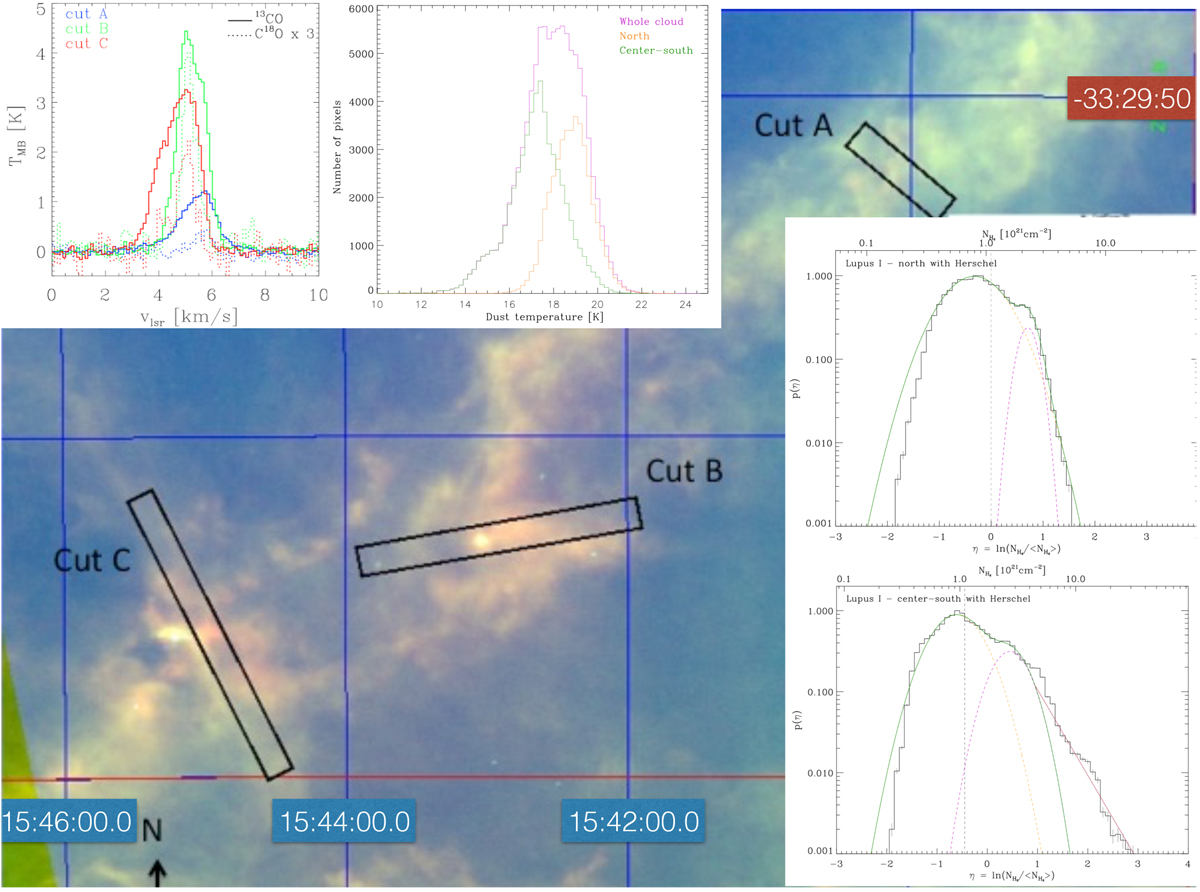
Fig. 3

Lupus I molecular cloud: combined image of the mosaics obtained with Spitzer/MIPS at 24 μm (blue), Herschel/PACS at 160 μm (green), and the Herschel/SPIRE at 500 μm (red), all in logarithmic scales. The right overplotted panels show the column density distribution functions of the northern (top panels) and southern (bottom panels) parts of Lupus I and the central panel shows the histograms of the dust temperature in different parts of the cloud (see details in Gaczkowski et al. 2015). Left panel: gas velocity profiles averaged along cuts A, B, and C, which are highlighted by the black boxes. Ecliptic coordinates are used for this figure to help identify northern and southern parts. Galactic coordinates of the centre of Lupus I: l = 338° 50′, b = 16° 40′.
Current usage metrics show cumulative count of Article Views (full-text article views including HTML views, PDF and ePub downloads, according to the available data) and Abstracts Views on Vision4Press platform.
Data correspond to usage on the plateform after 2015. The current usage metrics is available 48-96 hours after online publication and is updated daily on week days.
Initial download of the metrics may take a while.


