| Issue |
A&A
Volume 618, October 2018
|
|
|---|---|---|
| Article Number | A49 | |
| Number of page(s) | 4 | |
| Section | Astrophysical processes | |
| DOI | https://doi.org/10.1051/0004-6361/201833731 | |
| Published online | 11 October 2018 | |
Anharmonicity and the infrared emission spectrum of highly excited polycyclic aromatic hydrocarbons
1
Leiden University, Leiden Observatory, Niels Bohrweg 2, 2333 CA Leiden, The Netherlands
e-mail: This email address is being protected from spambots. You need JavaScript enabled to view it.
2
School of Engineering Sciences in Chemistry, Biotechnology and Health, Department of Theoretical Chemistry & Biology, Royal Institute of Technology, 10691 Stockholm, Sweden
3
NASA Ames Research Center, Moffett Field, CA
94035-1000, USA
Received:
28
June
2018
Accepted:
29
July
2018
Abstract
Aims. Infrared (IR) spectroscopy is a powerful tool to study molecules in space. A key issue in such analyses is understanding the effect that temperature and anharmonicity have on different vibrational bands, and thus interpreting the IR spectra for molecules under various conditions.
Methods. We combined second order vibrational perturbation theory and the Wang-Landau random walk technique to produce accurate IR spectra of highly excited polycyclic aromatic hydrocarbons. We fully incorporated anharmonic effects, such as resonances, overtones, combination bands, and temperature effects.
Results. The results are validated against experimental results for the pyrene molecule (C16H10). In terms of positions, widths, and relative intensities of the vibrational bands, our calculated spectra are in excellent agreement with gas-phase experimental data.
Key words: astrochemistry / ISM: lines and bands / photon-dominated region
© ESO 2018
1. Introduction
Polycyclic aromatic hydrocarbons (PAHs) are a class of organic molecules that are generally thought to be responsible for aromatic infrared bands (AIBs). This family of discrete emission features has been recorded in the mid-infrared (3–20 μm; mid-IR) from a wide variety of astronomical objects in the Milky Way and galaxies at least to z = 4 (Sajina et al. 2007; Riechers et al. 2014). These features are very strong, accounting for 20–30% of the infrared (IR) galactic emission and up to 10% of the total output in star-forming galaxies (Tielens 2008).
PAH molecules are excited by the absorption of a visible/UV photon and undergo internal conversion, where the excess energy is converted from electronic to nuclear degrees of freedom, while they relax to the electronic ground state. Subsequently, the energy is redistributed among the vibrational degrees of freedom (i.e., intramolecular vibrational redistribution; IVR) and the vibrationally excited molecules cool down through emitting IR photons (Allamandola et al. 1985, 1989).
Because of the highly challenging nature of the experiments, only a few emission spectra of highly excited, gaseous PAHs have been recorded using a very sensitive IR detector (Cook & Saykally 1998; Wagner et al. 2000). These spectra show that band positions are shifted with respect to those of low-temperature absorption spectra and that the shift, as well as the band width, depends on the internal excitation of the molecule. These effects are clear signs of the anharmonicity of the potential energy surface (PES; Cook & Saykally 1998).
From the theoretical point of view, several methods can be used to calculate IR vibrational spectra that take excitation and anharmonic effects into account. Generally, the anharmonicities, basis set incompleteness, and approximations in the treatment of electron correlation can be corrected using empirical scaling factors applied on the harmonic frequencies obtained from a static quantum chemical calculation and this has been widely used in the astrophysical literature (Langhoff 1996; Bauschlicher et al. 2008). Molecular dynamics (MD) simulations can also well describe the excitations and anharmonicities. These simulations provide the IR spectrum upon Fourier transformation of the autocorrelation of electric dipole moment. As no assumptions about the shape of the PES are made, MD intrinsically accounts for resonances, rovibrational couplings, and temperature effects (Schultheis et al. 2008; Van-Oanh et al. 2002; Kumar & Marx 2006; Estácio & Cabral 2008).
Alternatively, temperature-dependent IR spectra can be calculated by a time-independent or static method, which is incorporated through inverse Laplace transformation of quantum partition functions (Romanini & Lehmann 1993). The quantum partition functions are related to the microcanonical density of vibrational states, which are difficult to calculate for polyatomic molecules; the problem has only been satisfactorily solved for separable oscillators (Stein & Rabinovitch 1973). The vibrational density of states (DoS) can also be estimated by direct Monte Carlo (MC) integration (Noid et al. 1980; Farantos et al. 1982; Barker 1987). However, such methods become highly inefficient for large systems (Hüpper & Pollak 1999). An improved MC method, called the Wang-Landau method, has been introduced for handling large-dimensional space problems (Wang & Landau 2001). It has been shown that this method accurately reproduces vibrational DoS for large nonseparable systems (Basire et al. 2009; Calvo et al. 2010).
However, resonances and combination bands were not considered in this method. Recent works reveal that resonances and combination bands are important for comparison with high-resolution experimental IR spectra of PAHs, especially for the CH-stretching modes around 3000 cm−1 (Mackie et al. 2015; Maltseva et al. 2015). In this work, we apply the Wang-Landau method to calculate the IR emission spectrum of highly vibrationally excited pyrene, taking the effects of anharmonicity and resonances into account. This study is based upon the theoretical analysis of recent high-resolution spectra, which is calculated using second-order Vibrational Perturbations Theory (VPT2) calculations (Mackie et al. 2015).
2. Computational details
The IR spectra at a given internal energy were calculated by first computing the vibrational DoS using the Wang-Landau method (Basire et al. 2009). We then accumulated the two-dimensional histogram of the intensity of transitions; finally, we converted the accumulated absorption histogram to microcanonical absorption spectrum at a fixed internal energy. For comparison to the NIST spectra (Linstrom & Mallard 2001), obtained in thermal equilibrium, we derive the absorption intensity at finite temperature by a Laplace transformation.
The vibrational DoS are calculated by a random walk in energy space (Basire et al. 2009)
 (1)
(1)
where n (n1, n2, ...), are the quantum numbers representing the states of each vibrational energy level. The harmonic vibrational frequencies ωi and anharmonic couplings χij are calculated using VPT2 based on a semidiagonal quartic force field computed with density functional theory (DFT) as implemented in the Gaussian 09 package (Frisch et al. 2009). The hybrid density functional B3LYP method (Becke 1992; Lee et al. 1988) with the N07D basis set (Barone & Cimino 2008) are utilized for all the calculations. For the geometry optimization a very tight convergence criterion and a very fine grid (Int = 200 974) are used in the numerical integration (Cané et al. 2007; Bloino et al. 2015). The resonant states are evaluated through VPT2 approach, in which Fermi, Darling-Dennison, and vibrational Coriolis resonances are treated through a polyad approach (Martin et al. 1995) as described previously (Mackie et al. 2015). At any point during the random walk, resonance effects on the vibrational frequencies have to be evaluated using the polyad as the excitation in the different modes changes.
The effects of internal excitation are included through a second MC simulation in the space of quantum numbers. In brief, during the random walk, the quantum numbers (n) of the different modes changes, which directly affects the excitation energy of each mode (cf. Eq. (1)). At every step the effects of anharmonicity and resonances have to be evaluated in order to obtain a reasonable band width and position, and in the treatment of resonances only the diagonal elements of the resonance matrix have to be updated, which makes for a very efficient algorithm (Mackie et al. 2018). The energy dependent spectra are accumulated during the second Wang-Landau walks following the previously calculated DoS. At each Wang-Landau step, an IR spectrum (produced by that particular random configuration of quanta) is added to that energy-dependent spectrum. The line positions are determined by Eq. (1) and intensities by the following formula:
 (2)
(2)
where I(v, E) is the intensity of vibrational mode v at energy E, nk is the number of quanta in mode k, and σωk is the absorption cross section of mode ωk (Basire et al. 2009).
It is possible to include rotational excitation effects on the vibrational spectra as well (Basire et al. 2009). However, as we are ultimately interested in the UV-pumped IR fluorescence of initially very cold PAH species in the interstellar medium (ISM) and rotations are poorly coupled to the vibrational excitation (Ysard & Verstraete 2010), we ignored rotational effects in this work.
3. Results and discussion
The method has been validated through comparison with experimental spectra downloaded from the NIST Chemistry WebBook (Linstrom & Mallard 2001). Figure 1 shows the temperature effects on the IR spectrum of pyrene (C16H10) and comparison with the NIST data. The NIST spectrum is recorded at room temperature, i.e., ~300 K. The calculation generates reasonable spectra as shown in Fig. 1. The broadening and peak shift due to the increase of temperature are a direct consequence (in terms of peak position and relative intensity) of the anharmonic interaction, i.e., no artificial broadening or frequency correction factor is applied. Owing to the lack of rotational effects in the calculation, the calculated spectra are narrower than the NIST data.
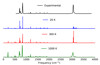 |
Fig. 1 Gas-phase experimental NIST IR spectrum of pyrene (~300 K) and comparison with calculated anharmonic spectra at temperatures 20 K, 300 K, and 1500 K. No artificial broadening is applied. The broadening and peak shift are a direct consequence of the anharmonic interaction. |
Figure 2 compares the IR emission spectra of the gas-phase UV laser-excited pyrene in the C-H stretching region (3.3 μm). The experimental spectrum was measured using the Berkeley Single Photon InfraRed Emission Spectrometer (SPIRES; Schlemmer et al. 1994; Wagner et al. 2000). A plume of pyrene is vaporized into the gas phase using a 258 nm laser. The absorption of a laser photon also provides an internal energy of 5 eV into the pyrene molecule. The spectrum is integrated over some 100 ms as the plume expands. The spectra of several laser shots obtained over 10–100 s are summed to increase the signal to noise. As radiative relaxation takes about 1 s, each individual spectrum corresponds to pyrene with an internal energy of 5 eV. This elegant experiment is well designed to simulate the environment of the ISM as pyrene is highly vibrationally excited but rotationally cold. This also provides an excellent platform to validate our model. Comparing the spectra calculated at 5 eV internal energy with those at 0 K shows the effect of internal excitation on the anharmonic interaction, which leads to a pronounced redshift and broadening of the individual features (Fig. 2). A vibrational temperature can be estimated using the SPIRES frequencies in conjunction with the redshift measurements, which yields a temperature of 1019 K for pyrene (Joblin et al. 1994; Cook et al. 1996). Much of the individual structure blends into several broad features. At the resolution of the experimental spectra (~100), these broad features blend together even further. The resulting calculated spectrum is in good agreement with the measured spectrum in peak position, overall profile, and width.
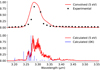 |
Fig. 2 Temperature effects on IR spectrum of pyrene and comparison with the experimental spectrum (black dots), which was measured using SPIRES (Wagner et al. 2000). The red curves represent the calculated anharmonic emission spectrum after absorbing a 5 eV photon. In order to compare the band profiles with the experimental data, the calculated spectrum in the top panel is convolved with Gaussian functions. The blue lines represent the fundamental and combination bands calculated at 0 K, i.e., without temperature effects considered in the calculations. |
Figure 3 compares the emission spectrum of pyrene in the 5–9 μm region as measured by SPIRES (Cook et al. 1996). Again, there are no free parameters in this analysis as anharmonic interaction dictates the frequency shift, broadening, and intensity of the bands. Over this wavelength regime, calculated peak positions are in reasonable agreement with the experiments but the calculated bandwidth seems somewhat narrower than the experiments indicate. We note that the bands shortward of 6 μm are combination bands, which in the double harmonic approximation have no intrinsic intensity. In anharmonic calculations, these bands obtain IR intensity through inclusion of an anharmonic dipole surface. The good agreement in calculated (relative) strength for all bands over this full wavelength region is therefore very impressive.
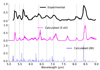 |
Fig. 3 Temperature effects on IR spectrum of pyrene in 5–9 μm region and comparison with experimental data (blue curve in the top panel) (Cook et al. 1996). The red curve represents the calculated anharmonic emission spectrum after absorbing a 5 eV photon. The blue sticks are the fundamental and combination bands calculated at 0 K, i.e., without temperature effects considered in the calculations. The gray dashed lines show prominent bands observed on the experimental spectrum. |
The 11–15 μm region contains the out-of-plane bending modes. Pyrene has duo and trio H’s1, This results in one strong band at ~11.7 μm where both the duos and trios move in unison out of the plane. The weaker longer wavelength bands show combined activity in the CH out-of-plane bending and CCC skeletal motions. Again, the bands shift and broaden significantly upon excitation (Fig. 4). The calculated peak position and bandwidth of the out-of-plane bending mode are in good agreement with the experiment. Surprisingly, the longer wavelength modes are not present in the experiments, perhaps reflecting limited signal to noise in this region.
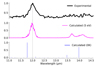 |
Fig. 4 Temperature effects on IR spectrum of pyrene in 12 μm region and comparison with experimental data (blue curve in the top panel) (Cook et al. 1996). The red curve represents the calculated anharmonic emission spectrum after absorbing a 5 eV photon. The blue sticks are the fundamental and combination bands calculated at 0 K, i.e., without temperature effects considered in the calculations. The gray dashed line shows the main band observed on the experimental spectrum. |
Overall, the agreement between the calculations and experiments is good. Peak positions agree typically to better than 1.5%. The agreement in width is somewhat worse (~30%). This agreement is particularly impressive given that there are no adjustable parameters. Both frequency shifts, broadening, and relative strength are fully prescribed by the anharmonic and resonance interactions between the modes calculated using VPT2/DFT, and the other controlling parameter, the internal energy, is fixed by the laser energy. The remaining small differences in peak position may reflect small inaccuracies in the calculated anharmonic coefficients as the effects of these get amplified upon excitation. In the 3 μm region of the spectrum, the effects of resonances are strongest. In this wavelength region, differences between calculated and measured spectra may reflect the importance of triple combination bands as experiment and theory indicate that these are important in understanding the number of bands and their relative strength in low temperature absorption spectra (Maltseva et al. 2015). Further improvement in the theory will have to await development of efficient methods to calculate the effects of triple combination bands on the spectra of highly excited molecules and/or a further refinement of the calculated anharmonic interaction coefficients.
With the launch of the James Webb Space Telescope, moderate resolution (R ~ 3000) mid-IR (3–28 μm) spectroscopy of a wide range of astronomical sources is coming into reach. The results shown in this paper go a long way toward validating astronomical PAH emission models. If this model can be extended in an efficient way to larger PAHs and derivatives, this carries the promise of an in-depth analysis of the astronomical data and a deep understanding of the interstellar PAH family.
4. Conclusions
In this work, we calculated the anharmonic IR absorption and emission spectra of pyrene. The VPT2 and Wang-Landau method are combined in order to account for temperature effects on the molecule. The results are compared with experimental gas-phase IR spectra. The band position, band profile, and intensities of the experimental spectra are accurately reproduced by the model. The results demonstrate that anharmonicity and temperature effects are necessary for understanding the PAH spectra. The model can be used as a powerful tool for studying the fine structure of IR spectra, which could provide detailed information regarding the ecosystem of molecules in space. This model might also be used for species identification and for extrapolating to areas where experimental data are limited.
Duo: two adjacent C atoms, each with an H atom. Trio: three adjacent C atoms, each with an H atom.
Acknowledgments
This work is supported by Swedish Research Council (Contract No. 2015-06501). The facility is supported by the Swedish National Infrastructure for Computing (Project No. SNIC 2018/3-30). The calculations were carried out on Kebnekaise and Abisko located at High Performance Computing Center North (HPC2N). We thank Julien Bloino for fruitful discussions and generously providing knowledge on the GVPT2 calculations. Special thanks to Ye Zhang and Andrey R. Maikov. AC acknowledges NWO for a VENI grant (639.041.543). TJL is supported by the National Aeronautics and Space Administration through the NASA Astrobiology Institute under Cooperative Agreement Notice NNH13ZDA017C issued through the Science Mission Directorate as well as support from the NASA 16-PDART16 2-0080 grant. We acknowledge the European Union (EU) and Horizon 2020 funding awarded under the Marie Skłodowska Curie action to the EUROPAH consortium, grant number 722346. Studies of interstellar PAHs at Leiden Observatory are supported through a Spinoza award.
References
- Allamandola, L., Tielens, A., & Barker, J. 1985, ApJ, 290, L25 [NASA ADS] [CrossRef] [Google Scholar]
- Allamandola, L., Tielens, A., & Barker, J. 1989, ApJS, 71, 733 [NASA ADS] [CrossRef] [Google Scholar]
- Barker, J. R. 1987, J. Phys. Chem., 91, 3849 [CrossRef] [Google Scholar]
- Barone, V., & Cimino, P. 2008, Chem. Phys. Lett., 454, 139 [NASA ADS] [CrossRef] [Google Scholar]
- Basire, M., Parneix, P., Calvo, F., Pino, T., & Bréchignac, P. 2009, J. Phys. Chem. A, 113, 6947 [CrossRef] [PubMed] [Google Scholar]
- Bauschlicher, C. W., Jr. Peeters, E., & Allamandola, L. J. 2008, ApJ, 678, 316 [NASA ADS] [CrossRef] [Google Scholar]
- Becke, A. D. 1992, J. Chem. Phys., 96, 2155 [NASA ADS] [CrossRef] [Google Scholar]
- Bloino, J., Biczysko, M., & Barone, V. 2015, J. Phys. Chem. A, 119, 11862 [CrossRef] [PubMed] [Google Scholar]
- Calvo, F., Parneix, P., & Van-Oanh, N.-T. 2010, J. Chem. Phys., 133, 074303 [NASA ADS] [CrossRef] [PubMed] [Google Scholar]
- Cané, E., Miani, A., & Trombetti, A. 2007, J. Phys. Chem. A, 111, 8218 [CrossRef] [PubMed] [Google Scholar]
- Cook, D., & Saykally, R. 1998, ApJ, 493, 793 [NASA ADS] [CrossRef] [PubMed] [Google Scholar]
- Cook, D., Schlemmer, S., Balucani, N., et al. 1996, Nature, 380, 227 [NASA ADS] [CrossRef] [PubMed] [Google Scholar]
- Estácio, S. G., & Cabral, B. C. 2008, Chem. Phys. Lett., 456, 170 [NASA ADS] [CrossRef] [Google Scholar]
- Farantos, S., Murrell, J., & Hajduk, J. 1982, Chem. Phys., 68, 109 [CrossRef] [Google Scholar]
- Frisch, M., Trucks, G., Schlegel, H. B., et al. 2009, Gaussian 09, revision E. 01 (Wallingford, CT: Gaussian Inc.) [Google Scholar]
- Hüpper, B., & Pollak, E. 1999, J. Chem. Phys., 110, 11176 [NASA ADS] [CrossRef] [Google Scholar]
- Joblin, C., d’Hendecourt, L., Léger, A., & Defourneau, D. 1994, A&A, 281, 923 [NASA ADS] [Google Scholar]
- Kumar, P., & Marx, D. 2006, Phys. Chem. Chem. Phys., 8, 573 [Google Scholar]
- Langhoff, S. R. 1996, J. Phys. Chem., 100, 2819 [CrossRef] [Google Scholar]
- Lee, C., Yang, W., & Parr, R. G. 1988, Phys. Rev. B, 37, 785 [Google Scholar]
- Linstrom, P. J., & Mallard, W. G. 2001, J. Chem. Eng. Data, 46, 1059 [Google Scholar]
- Mackie, C. J., Candian, A., Huang, X., et al. 2015, J. Chem. Phys., 143, 224314 [NASA ADS] [CrossRef] [Google Scholar]
- Mackie, C., Chen, T., Candian, A., et al. 2018, J. Chem. Phys., 149, 134302 [NASA ADS] [CrossRef] [Google Scholar]
- Maltseva, E., Petrignani, A., Candian, A., et al. 2015, ApJ, 814, 23 [NASA ADS] [CrossRef] [Google Scholar]
- Martin, J. M., Lee, T. J., Taylor, P. R., & François, J.-P. 1995, J. Chem. Phys., 103, 2589 [NASA ADS] [CrossRef] [Google Scholar]
- Noid, D., Koszykowski, M., Tabor, M., & Marcus, R. 1980, J. Chem. Phys., 72, 6169 [NASA ADS] [CrossRef] [Google Scholar]
- Riechers, D. A., Pope, A., Daddi, E., et al. 2014, ApJ, 786, 31 [NASA ADS] [CrossRef] [Google Scholar]
- Romanini, D., & Lehmann, K. K. 1993, J. Chem. Phys., 98, 6437 [NASA ADS] [CrossRef] [Google Scholar]
- Sajina, A., Yan, L., Armus, L., et al. 2007, ApJ, 664, 713 [NASA ADS] [CrossRef] [Google Scholar]
- Schlemmer, S., Cook, D., Harrison, J., et al. 1994, Science, 265, 1686 [NASA ADS] [CrossRef] [PubMed] [Google Scholar]
- Schultheis, V., Reichold, R., Schropp, B., & Tavan, P. 2008, J. Phys. Chem. B, 112, 12217 [CrossRef] [Google Scholar]
- Stein, S. E., & Rabinovitch, B. 1973, J. Chem. Phys., 58, 2438 [NASA ADS] [CrossRef] [Google Scholar]
- Tielens, A. G. G. M. 2008, ARA&A, 46, 289 [NASA ADS] [CrossRef] [EDP Sciences] [Google Scholar]
- Van-Oanh, N.-T., Parneix, P., & Bréchignac, P. 2002, J. Phys. Chem. A, 106, 10144 [CrossRef] [Google Scholar]
- Wagner, D., Kim, H., & Saykally, R. 2000, ApJ, 545, 854 [NASA ADS] [CrossRef] [MathSciNet] [PubMed] [Google Scholar]
- Wang, F., & Landau, D. 2001, Phys. Rev. Lett., 86, 2050 [NASA ADS] [CrossRef] [PubMed] [Google Scholar]
- Ysard, N., & Verstraete, L. 2010, A&A, 509, A12 [NASA ADS] [CrossRef] [EDP Sciences] [Google Scholar]
All Figures
|
Fig. 1 Gas-phase experimental NIST IR spectrum of pyrene (~300 K) and comparison with calculated anharmonic spectra at temperatures 20 K, 300 K, and 1500 K. No artificial broadening is applied. The broadening and peak shift are a direct consequence of the anharmonic interaction. |
| In the text | |
|
Fig. 2 Temperature effects on IR spectrum of pyrene and comparison with the experimental spectrum (black dots), which was measured using SPIRES (Wagner et al. 2000). The red curves represent the calculated anharmonic emission spectrum after absorbing a 5 eV photon. In order to compare the band profiles with the experimental data, the calculated spectrum in the top panel is convolved with Gaussian functions. The blue lines represent the fundamental and combination bands calculated at 0 K, i.e., without temperature effects considered in the calculations. |
| In the text | |
|
Fig. 3 Temperature effects on IR spectrum of pyrene in 5–9 μm region and comparison with experimental data (blue curve in the top panel) (Cook et al. 1996). The red curve represents the calculated anharmonic emission spectrum after absorbing a 5 eV photon. The blue sticks are the fundamental and combination bands calculated at 0 K, i.e., without temperature effects considered in the calculations. The gray dashed lines show prominent bands observed on the experimental spectrum. |
| In the text | |
|
Fig. 4 Temperature effects on IR spectrum of pyrene in 12 μm region and comparison with experimental data (blue curve in the top panel) (Cook et al. 1996). The red curve represents the calculated anharmonic emission spectrum after absorbing a 5 eV photon. The blue sticks are the fundamental and combination bands calculated at 0 K, i.e., without temperature effects considered in the calculations. The gray dashed line shows the main band observed on the experimental spectrum. |
| In the text | |
Current usage metrics show cumulative count of Article Views (full-text article views including HTML views, PDF and ePub downloads, according to the available data) and Abstracts Views on Vision4Press platform.
Data correspond to usage on the plateform after 2015. The current usage metrics is available 48-96 hours after online publication and is updated daily on week days.
Initial download of the metrics may take a while.