Fig. 3
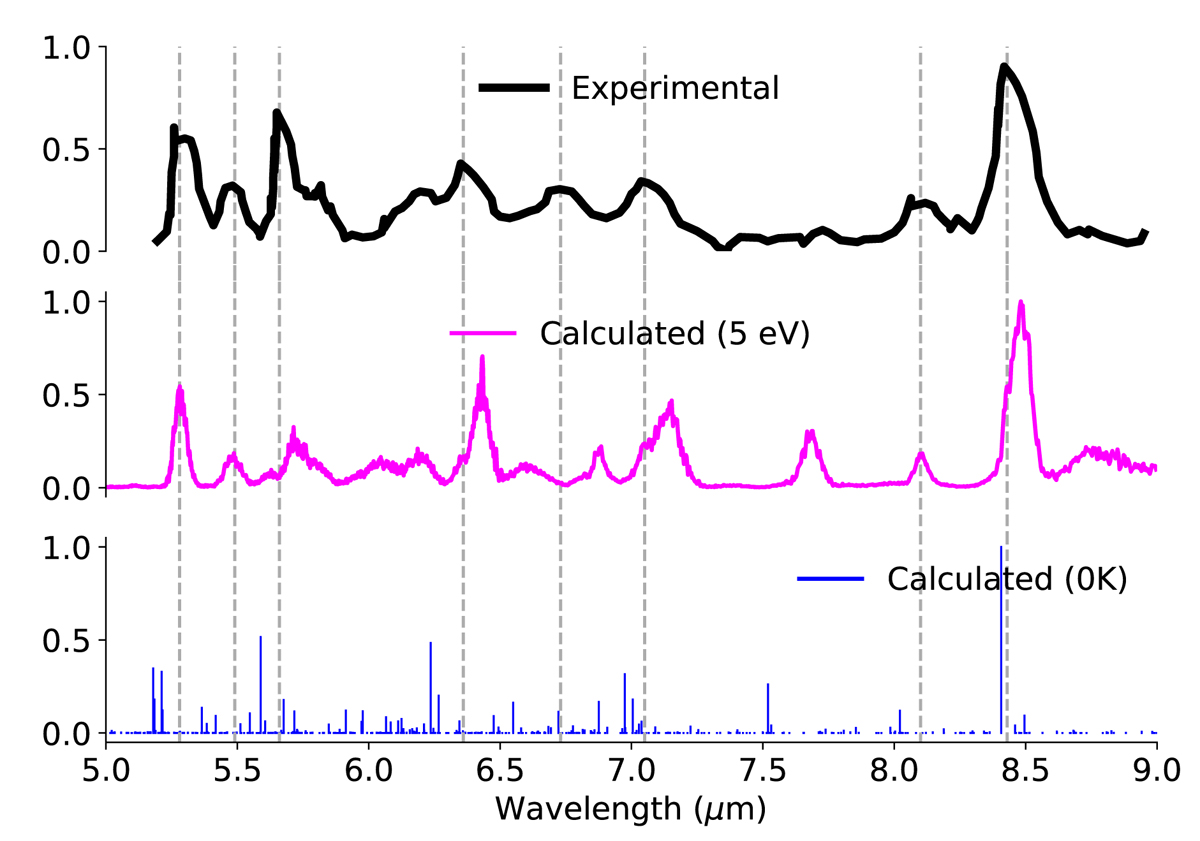
Temperature effects on IR spectrum of pyrene in 5–9 μm region and comparison with experimental data (blue curve in the top panel) (Cook et al. 1996). The red curve represents the calculated anharmonic emission spectrum after absorbing a 5 eV photon. The blue sticks are the fundamental and combination bands calculated at 0 K, i.e., without temperature effects considered in the calculations. The gray dashed lines show prominent bands observed on the experimental spectrum.
Current usage metrics show cumulative count of Article Views (full-text article views including HTML views, PDF and ePub downloads, according to the available data) and Abstracts Views on Vision4Press platform.
Data correspond to usage on the plateform after 2015. The current usage metrics is available 48-96 hours after online publication and is updated daily on week days.
Initial download of the metrics may take a while.