| Issue |
A&A
Volume 618, October 2018
|
|
|---|---|---|
| Article Number | L1 | |
| Number of page(s) | 8 | |
| Section | Letters to the Editor | |
| DOI | https://doi.org/10.1051/0004-6361/201833719 | |
| Published online | 05 October 2018 | |
Letter to the Editor
Radial and vertical dust transport inhibit refractory carbon depletion in protoplanetary disks
Astronomical Institute Anton Pannekoek, University of Amsterdam, Science Park 904, 1098 XH Amsterdam, The Netherlands
e-mail: l.a.klarmann@uva.nl
Received:
28
June
2018
Accepted:
5
September
2018
Context. The Earth is strongly depleted in carbon compared to the dust in the ISM, implying efficient removal of refractory carbon before parent body formation. It has been argued that grains get rid of their carbon through oxidation and photolysis in the exposed upper disk layers.
Aims. We assess the efficacy of these C-removal mechanisms, while accounting for the vertical and radial transport of grains.
Methods. We obtained the carbon and carbon free mass budget of solids by solving two 1D advection-diffusion equations, accounting for the dust grain size distribution and radial transport. The carbon removal acts on the fraction of the grains that are in the exposed layer and requires efficient vertical transport.
Results. In models without radial transport, oxidation and photolysis can destroy most of the refractory carbon in terrestrial planet formation region. But it only reaches the observed depletion levels for extreme parameter combinations and requires that parent body formation was delayed by 1 Myr. Adding radial transport of solids prevents the depletion entirely, leaving refractory carbon equally distributed throughout the disk.
Conclusions. It is unlikely that the observed carbon depletion can ultimately be attributed to mechanisms operating on small grains in the disk surface layers. Other mechanisms of removing carbon quickly and deeply must be studied, for example flash heating events or FU Ori outbursts. However, a sustained drift barrier or strongly reduced radial grain mobility is necessary to prevent replenishment of carbon from the outer disk.
Key words: protoplanetary disks / planets and satellites: composition / astrochemistry
© ESO 2018
1. Introduction
The Earth is significantly depleted in carbon (Allègre et al. 2001). Its silicon to carbon ratio is a factor of 10−4 lower than in the Sun (Grevesse et al. 2010) or in the interstellar medium (ISM), the base material it formed from Bergin et al. (2015). The picture is different for objects formed further out in the solar nebula. The silicon to carbon ratio of carbonaceous chondrites is only a factor 100 lower than in the ISM (Wasson & Kallemeyn 1988), and many comets are not carbon depleted at all (Wooden 2008). This seems to show a gradient of carbon depletion in the solar system, with depletion getting stronger for objects that formed closer to the Sun (e.g. Pontoppidan et al. 2014; Lee et al. 2010; Geiss 1987).
However, more than half of the carbon in the ISM is expected to be refractory material (Zubko et al. 2004). Several processes have been suggested to remove this refractory carbon from the inner regions of a protoplanetary disks. Gail & Trieloff (2017) investigate the destruction of refractory carbon species within their radial transport models (see also Gail 2001), but find that oxidation in the disk mid-plane via OH molecules (Finocchi et al. 1997) is not sufficient to deplete the inner disk region of carbon. Anderson et al. (2017) employ carbon oxidation via atomic oxygen in the hot, upper disk layer (following Lee et al. 2010) and the photolysis of carbon grainsdirectly via UV photons (Alata et al. 2014). In the inner disk regions they reach a carbon depletion comparable to the Earth, but only if all refractory material is in small grains and without taking into account radial dust transport. In this work, we study how the presence of large grains and vertical and radial dust transport influence the refractory carbon in a protoplanetary disk. We investage the viability of depleting the inner disk region via oxidation and photolysis in the upper disklayers.
2. Model
2.1. Disk model
For the star we took M⋆ = 1 M⊙, L⋆ = 1 L⊙ and the UV field was set to LUV = 0.01 L⋆. The total disk mass is set to 0.039 M⊙. We adopted a dust-to-gas ratio of 0.01, similar to Anderson et al. (2017) and Kamp et al. (2017). The disk surface density follows a power-law profile with Σ ∝ r−1 and is exponentially cut-off at 200 au. The carbon mass fraction fc(r) is defined as the ratio of the solid carbon surface density and the total dust surface density, fc = Σc/Σtot. We assumed an initial carbon-to-hydrogen abundance of 2 × 10⁻⁴, which agrees with solar (Asplund et al. 2009) and ISM abundances (Jenkins 2009). Like Anderson et al. (2017), we divided carbon equally between volatiles and refractory grains (see also Zubko et al. 2004). This leads to an initial refractory carbon mass fraction of fc ≈ 0.25.
We used a 1+1 D approach to describe the dust movement and composition. The radial dust transport, together with grain growth and fragmentation, is modelled using the twopoppy code by Birnstiel et al. (2012); Birnstiel et al. (2015) and using a fragmentation velocity vf = 10 m s−1 throughout the disk (see Appendix B).
We refer to the surface layer of the disk where the refractory carbon gets destroyed as the exposed layer, because that layer is exposed to UV photons from the star. This is the layer where carbon reacts with free oxygen and where most of the photolysis occurs. We denote the vertical coordinate of the exposed layer as z1 and its dust surface density as Σ*. Figure 1 shows the model setup, depicting the exposed layer above a height z1 as a function of the disk radius r. It also indicates the vertical range of the dust movment described in Sect. 2.4.
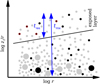 |
Fig. 1. Height of the exposed layer divided by the disk radius z1/r against disk radius r. Silicate grains are plotted in grey, carbon grains in black. Large grains are settled close to the midplane. In the exposed layer above z1, carbon grains can be oxidised, indicated in red. The range of vertical dust movement is shown by blue arrows. Grains stay for tres in the exposed layer, and within tmix, material from the exposed layer is well-mixed with material from the midplane. |
2.2. Calculation of the location of the exposed layer
The exposed layer can be reached by stellar photons. Determining the height z1 of the exposed layer comes down to determining the height at which small grains still coupled to the gas provide the required optical depth. Because of the flaring geometry of the disk, a radial optical depth τr = 1 corresponds to a vertical depth τz = Φ where Φ = 0.05 is the disk flaring angle. The value of z1 depends on the total dust surface density Σtot, the grain size distribution, the grain opacity κ, and grain settling. We assumed that the grains in the exposed layer are in the Rayleigh regime and take κ = κ
0 = 2 × 104 cm2 g−1 independent of grain radius s1. The surface density Σ* of the exposed layer then follows, Σ* = Φ/κ0. For simplicity, we assumed that large grains in the optically geometrical limit, s > s
geo = λ/2π ≈ 0.1 μm for λ = 0.55 μm, do not contribute to the optical opacity. Then, (1)
(1)
where f≤s = (s/smax)4 − p is the fraction by mass of grains smaller than radius s, assuming a power-law size distribution with exponent with p = 3.5 and maximum grain radius smax determined by drift and fragmentation (see Appendix B). Similarly f≥z is the fraction of the surface density above height z (2)
(2)
In calculating this fraction we have used the dust scale height hgr based on the local Stokes number St corresponding to z and the turbulent α parameter,  . Hence f≤s increases with s while f≥z (for a fixed z) decreases with s.
Figure 2 illustrates these points, plotting the height z where τr = 1 as function of grain radius s. Grains contribute to the opacity build up in the exposed layer up to a size s1. Ignoring their settling, all grains would contribute to the exposed layer which would therefore lie very high in the disk. In reality settling causes the largest grains to drop out of the exposed layer. We identify the point where τr = 1 peaks as the size s1 and the height z1. In our definition of f≥z(s, z), it is assumed that all grains smaller than s settle to the same height as grains with radius s, which is the reason why f≥z(s, z) eventually decreases with size s. Although, this would be incorrect in a cumulative sense (extending the distribution to include larger grains should not decrease the mass fraction) it here simply serves the point of finding the size where grains decouple.
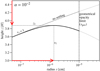 |
Fig. 2. Height z vs. grain radius s where τr = 1 at r = 1 au. The peak of the z coordinate of τr defines the height of the exposed layer z1 and the radius s1 up to which grains contribute to the opacity in the exposed layer (red arrows). Grains larger than s1 are too settled to contribute. The size sgeo is an upper limit for s1 as the opacity decreases with larger grain sizes. |
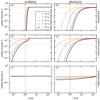 |
Fig. 3. All panels show the carbon fraction fc = Σc/Σtot as function of disk radius r. Coloured lines show the time evolution of the carbon fraction fc in the fiducial model from 104 yr to 106 yr. The vertical line indicates Earth’s position. The horizontal dashed line shows depletion by a factor ten. Left: carbon removal by oxidation. Right: carbon removal by photolysis. Top panels: the oxidation (photolysis) fcΣ*/tox (fcΣph*/tph) is applied to the carbon in the exposed layer unrestricted by vertical or radial transport. Middle panels: vertical dust transport is taken into account as described in Eq. (7) (Eq. (A.9)). Bottom panels: vertical and radial dust transport as described in Appendix B are included. The scale of the y-axis has been changed because of the low level of carbon depletion in these models. |
2.3. Carbon removal
Carbon removal in the exposed layer occurs via oxidation or photolysis (see Appendix A). The oxidation time for one carbon grain in the exposed layer is (3)
(3)
where ρc = 2 g−1 cm3 is the specific density of the carbon grain material, mc the mass of a carbon atom, nox the number density of oxygen atoms at z1, vox the oxygen thermal velocity and Yox the yield of the oxidation (Draine 1979). The photolysis rate is (4)
(4)
where FUV is the UV flux and mc the mass of a carbon atom. The flaring angle Φ corrects for the fact that the UV photons do not hit the disk surface perpendicular. The yield is Yph = 8 × 10⁻⁴ (Alata et al. 2014; Alata et al. 2015).
A more detailed description of these processes can be found in Lee et al. (2010) and Anderson et al. (2017) and in Appendix A.
Carbon fraction fc = Σc/Σtot after 1 Myr at 1 au for models limited by vertical transport and models limited by vertical and radial transport.
2.4. Effects of vertical dust transport on removal rates
The efficacy of carbon removal is limited by the ability to vertical transport (cycle) the dust. There are two important timescales regarding to the vertical motions of grains. The first is the overall mixing time tmix, indicating on what timescale material from the midplane and the exposed layer become well-mixed. We obtain tmix from the turbulent diffusivity and the gas scale height H: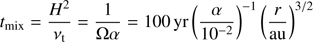 (5)
(5)
where the turbulent diffusivity is assumed equal to the gas viscosity νt and is parametrised using the α prescription (νt = αH2Ω; Shakura & Sunyaev 1973) with Ω the Keplerian frequency. After one mixing timescale, carbon-depleted material from the exposed layer and carbon-rich material from the midplane are well mixed.
The other relevant timescale is the residence time2 of a grain in the exposed layer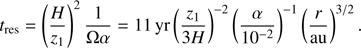 (6)
(6)
This time is shorter than tmix because the local pressure scale height at height z ≫ H is given by H2/z. A long tres would limit carbon destruction, because the exposed layer will become depleted in refractory carbon. In that case no carbon will be burned, because carbon-free solids build up the opacity in the exposed layer. Hence, carbon removal becomes inefficient when tres is longer than the time to burn a single grain tox (see Eq. (3)).
Accounting for these vertical transport effects, we obtain a carbon destruction rate of: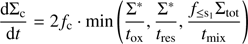 (7)
(7)
where the factor two accounts for the two sides of the disk and Σc is the surface density of carbon grains with s < s1. This expression applies to C-burning; in Appendix A.2 a similar expression is derived for photolysis.
3. Results
Our results are presented in Fig. 3 for the oxidation (left) and the photolysis (right) models.
3.1. Unrestricted models
The upper row plots present the carbon fraction fc without including any transport-limiting factors, in other words, by using only the first term in Eq. (7) (fcΣ*/tox). As can be seen, oxidation depletes carbon by a factor of 10−4 out to 1.1 au. Beyond this point carbon burning is essentially shut off, because of the exponential dependence of the oxidation yield Yox on temperature. The photolysis rate, on the other hand, does not depend on temperature (FUV ∝ r−2 but Yph is constant). After 1 Myr, the disk is depleted by a factor of 10−4 out to 1.3 au and by a factor of 0.1 out to 7 au.
3.2. Vertical dust transport
Accounting for vertical transport effects – that is, including all three regimes in Eq. (7) – we see that oxidation (Fig. 3c) and photolysis (Fig. 3d) become less effective. Carbon oxidation inward of 1.3 au becomes now limited by the residence time tres. Grains that make it into the exposed layer burn their carbon atoms completely, rendering the overall burning inefficient. Similarly, the photolysis rate equals fcΣph*/tres − ph everywhere. The photolysis rate tends to be larger than the oxidation rate, because the UV photons penetrate more deeply, resulting in a larger exposed layer (see Appendix A.2). However, the photolysis run reaches depletion levels just short of 10−4 at 1 au.
3.3. Vertical and radial dust transport
Accounting in addition for radial transport (bottom panels of Fig. 3) further reduces the efficacy of carbon destruction. Carbon-rich solids from the outer disk simply drift into the inner region to replenish any carbon depleted material. The carbon destruction becomes drift-limited: carbon will only be depleted when the local destruction time (tdestr = Σc/(dΣc/dt)) becomes shorter than the drift timescale tdrift of the (mass-dominating) pebbles. Since tdrift tends to be rather short (200 yr at 1 au) depletion is minimal with little variation throughout the disk.
3.4. Parameter variation
In Table 1 we list the results from additional photolysis runs, quantifying the level of carbon depletion at 1 au after 1 Myr. A higher opacity, a lower α or a shallower grain size distribution (p = 3; fewer small grains) only reduce the carbon destruction, because Σ* becomes lower or tres increases. For the runs without radial transport, a stronger UV field enhances the depletion as the UV photons penetrate deeper. It can be argued that the low κ0 run is more appropriate for the opacity in the exposed layer, when the grains lose most of their carbon. This will increase Σ*, and completely remove all carbon interior to 1 au – but only when there is no radial replenishment. Similarly, reducing the fragmentation velocity to 3 m s−1 leads to more small grains and therefore a stronger depletion at 1 au in the case of only vertical transport. When radial transport is included, the carbon fraction is only reduced by a factor of two. Since the fragmentation velocity outside of the snowline is expected to be much higher than 3 m s−1, a more realistic case where the fragmentation velocity depends on the disk radius would lead to even less carbon depletion. In general, the replenishment of carbon via radial transport renders the depletion independent of the adopted parameters.
4. Discussion and conclusion
Our findings regarding unrestricted C-burning are in line with the study of Anderson et al. (2017). They, too, find that photolysis is the more significant C-depletion mechanism and that the inner disk can become devoid in carbon. Like us, Anderson et al. (2017) account for the limited total time grains spend in the exposed layers. However, they have overestimated the removal by incorrectly assuming that each stay in the exposed layer is short enough to ensure a continuous supply of carbon in the exposed layer. Instead, we found (even in the case of high turbulence) that carbon-depleted grains stay longer in the exposed layer than the time it takes to remove their carbon. This makes both oxidation and photolysis inefficient. Furthermore, adding radial dust transport to the model makes it impossible to deplete the inner disk of carbon even under extreme assumptions about the UV field of the early Sun or the grain opacities.
It is unlikely that other C-destruction mechanisms can change this outcome. Adding oxidation of carbon by OH in the midplane does not increase the carbon depletion sufficiently (Gail & Trieloff 2017). For high accretion rates, the midplane region can be heated to roughly 1500 K out to 2 au (Min et al. 2011). However, these accretion rates must then be sustained over a significant time to allow the Earth’s building blocks to form.
Therefore, we conclude that the only way to ensure the C depletion factors as observed in the solar system is to invoke an early hot or intense inner disk environment to ensure rapid C-destruction before parent body formation. This needs to happen in combination with a sustained barrier for drift to prevent C-replenishment, for example by the formation of a giant planet. FU Orionis events can lead to inner disk temperatures of several thousand Kelvin (Hartmann & Kenyon 1996; Zhu et al. 2007) over several decades. The composition of chondrules indicate that several flash heating events happened in the solar nebula (Ciesla et al. 2005; Jones et al. 2000), reaching temperatures of around 2000 K nearly instantly and cooling again within days. To prevent the fast replenishment of carbon, these events need to happen at a high frequency, comparable to the drift timescale. Events at a lower rate can also cause a sustained refractory carbon depletion in the inner disk region, but this requires radial grain mobility to be strongly reduced or halted.
We used κ 0 = 2 × 10⁴ g−1 cm2, which corresponds to a grain size distribution up to 0.1 μm with fc = 0.15 (Min et al. 2016). A correct opacity treatment would take the local grainsize distribution and fc into account, as well as icy grains in the outer disk. This could change κ0 by a factor of about five, an effect we explored in a small parameter study.
Anderson et al. (2017) define tres differently, as the total time a grain spends in the exposed layer over 1 Myr.
Acknowledgments
The authors thank the referee for valuable feedback. The authors thank Inga Kamp for sharing her ProDiMo model, Christian Rab for sharing prodimopy, Michiel Min for sharing OpacityTool, and Til Birnstiel for sharing twopoppy. We thank the above-mentioned and Rens Waters and Kaustubh Hakim for helpful discussions and Sebastiaan Krijt for his thoughtful comments on the manuscript. L.K. is supported by a grant from NOVA. C.W.O. acknowledges funding by the Netherlands Organization for Scientific Research (NWO; VIDI project 639.042.422). C.D. acknowledges funding by the NWO, project number 614.001.552.
References
- Alata, I., Cruz-Diaz, G.A., Muñoz Caro, G.M., & Dartois, E. 2014, A&A, 569, A119 [NASA ADS] [CrossRef] [EDP Sciences] [Google Scholar]
- Alata, I., Jallat, A., Gavilan, L., et al. 2015, A&A, 584, A123 [NASA ADS] [CrossRef] [EDP Sciences] [Google Scholar]
- Allègre, C., Manhès, G., & Lewin, É. 2001, Earth Planet. Sci. Lett., 185, 49 [NASA ADS] [CrossRef] [Google Scholar]
- Anderson, D. E., Bergin, E. A., Blake, G. A., et al. 2017, ApJ, 845, 13 [NASA ADS] [CrossRef] [Google Scholar]
- Asplund, M., Grevesse, N., Sauval, A. J., & Scott, P. 2009, ARA&A, 47, 481 [NASA ADS] [CrossRef] [Google Scholar]
- Bergin, E. A., Blake, G. A., Ciesla, F., Hirschmann, M. M., & Li, J. 2015, Proc. Nat. Acad. Sci., 112, 8965 [Google Scholar]
- Birnstiel, T., Klahr, H., & Ercolano, B. 2012, A&A, 539, A148 [NASA ADS] [CrossRef] [EDP Sciences] [Google Scholar]
- Birnstiel, T., Andrews, S. M., Pinilla, P., & Kama, M. 2015, ApJ, 813, L14 [NASA ADS] [CrossRef] [Google Scholar]
- Ciesla, F. J. 2005, in Chondrites and the Protoplanetary Disk, eds. A. N. Krot, & E. R. D. Scott , 341, 811 ASP Conf. Ser. [NASA ADS] [Google Scholar]
- Draine, B. T. 1979, ApJ, 230, 106 [NASA ADS] [CrossRef] [Google Scholar]
- Fedele, D., van Dishoeck, E. F., Kama, M., Bruderer, S., & Hogerheijde, M. R. 2016, A&A, 591, A95 [NASA ADS] [CrossRef] [EDP Sciences] [Google Scholar]
- Finocchi, F., Gail, H. P., & Duschl, W. J. 1997, A&A, 325, 1264 [NASA ADS] [Google Scholar]
- Gail, H. P. 2001, A&A, 378, 192 [NASA ADS] [CrossRef] [EDP Sciences] [Google Scholar]
- Gail, H.-P., & Trieloff, M. 2017, A&A, 606, A16 [NASA ADS] [CrossRef] [EDP Sciences] [Google Scholar]
- Geiss, J. 1987, A&A, 187, 859 [NASA ADS] [Google Scholar]
- Grevesse, N., Asplund, M., Sauval, A. J., & Scott, P. 2010, Ap&SS, 328, 179 [NASA ADS] [CrossRef] [Google Scholar]
- Hartmann, L., & Kenyon, S. J. 1996, ARA&A, 34, 207 [NASA ADS] [CrossRef] [EDP Sciences] [MathSciNet] [Google Scholar]
- Jenkins, E. B. 2009, ApJ, 700, 1299 [NASA ADS] [CrossRef] [Google Scholar]
- Jones, R. H., Lee, T., Connolly, Jr., H. C., Love, S. G., & Shang, H. 2000, Protostars and Planets IV , 927 [Google Scholar]
- Kamp, I., Thi, W.-F., Woitke, P., et al. 2017, A&A, 607, A41 [NASA ADS] [CrossRef] [EDP Sciences] [Google Scholar]
- Lee, J.-E., Bergin, E. A., & Nomura, H. 2010, ApJ, 710, L21 [NASA ADS] [CrossRef] [Google Scholar]
- Meijerink, R., Aresu, G., Kamp, I., et al. 2012, A&A, 547, A68 [NASA ADS] [CrossRef] [EDP Sciences] [Google Scholar]
- Min, M., Dullemond, C. P., Kama, M., & Dominik, C. 2011, Icarus, 212, 416 [NASA ADS] [CrossRef] [Google Scholar]
- Min, M., Rab, C., Woitke, P., Dominik, C., & Ménard, F. 2016, A&A, 585, A13 [NASA ADS] [CrossRef] [EDP Sciences] [Google Scholar]
- Pontoppidan, K. M., Salyk, C., & Bergin, E. A., et al. 2014, Protostars and Planets VI , 363 [Google Scholar]
- Shakura, N. I., & Sunyaev, R. A. 1973, A&A, 24, 337 [NASA ADS] [Google Scholar]
- van Zadelhoff, G.-J., Aikawa, Y., Hogerheijde, M. R., & van Dishoeck, E. F. 2003, A&A, 397, 789 [NASA ADS] [CrossRef] [EDP Sciences] [Google Scholar]
- Wasson, J. T., & Kallemeyn, G. W. 1988, Phil. Trans. R. Soc. London, Ser. A, 325, 535 [NASA ADS] [CrossRef] [Google Scholar]
- Wooden, D. H. 2008, Space Sci. Rev., 138, 75 [NASA ADS] [CrossRef] [Google Scholar]
- Zhu, Z., Hartmann, L., Calvet, N., et al. 2007, ApJ, 669, 483 [NASA ADS] [CrossRef] [Google Scholar]
- Zubko, V., Dwek, E., & Arendt, R. G. 2004, ApJS, 152, 211 [NASA ADS] [CrossRef] [Google Scholar]
Appendix A
Carbon removal
A.1 Oxidation
The exposed layer is characterized by a steep vertical gradient in gas temperature. However, most of the dust in the exposed layer will be found just above z1, corresponding to a radial optical depth of unity. Since the penetration of UV photons is also responsible for the heating of the gas, this location can be very well characterized by a single temperature. Based on previous observations and thermo-chemical disk modelling (Fedele et al. 2016; Kamp et al. 2017), we described the gas temperature in the exposed layer by (A.1)
(A.1)
with Ti = 750 K, ri = 1 au and q = 0.6. This temperature leads to a mean thermal velocity of oxygen atoms of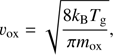 (A.2)
(A.2)
where kB is Boltzmann’s constant and mox is the mass of an oxygen atom.
The gas number density at z1 is then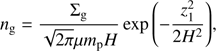 (A.3)
(A.3)
where Σg is the gas surface density, μ = 2.35 the mean molecular weight and mp the proton mass. We used the oxygen number density at z1, nox = ϵng, with ϵ = 10−4 as found in ProDiMo models by Meijerink et al. (2012) and similar to the value of ϵ ≈ 2 × 10⁻⁴ shown in Lee et al. (2010).
The probability of removing a carbon atom when a carbon grain is hit by an oxygen atom is given by the yield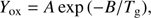 (A.4)
(A.4)
with A = 2.3, B = 2580 for Tg < 440 K and A = 170, B = 4430 for Tg > 440 K (Draine 1979).
The rate at which carbon is removed from a single grain by oxidation is (A.5)
(A.5)
where σ = πs2 is the grain cross section. For grains with radius s1 this leads to a carbon destruction time of: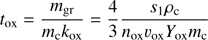 (A.6)
(A.6)
with mgr the mass of a carbon grain. Grains lose all their carbon when they reside for a time t ≫ tox in the exposed layer. The change in grain radius during oxidation is not taken into account in our model.
A.2 Photolysis
In the case of photolysis by UV photons, a fraction fcYph of the absorbed photons will remove a carbon atom directly, resulting in a destruction rate of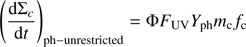 (A.7)
(A.7)
where FUV is the UV field. The flaring angle Φ corrects for the fact that the UV photons do not hit the disk surface perpendicular. The yield is Yph = 8 × 10⁻⁴ (Cruz-Diaz et al. 2014; Alata et al. 2015; Anderson et al. 2017).
Analogous to oxidation, photolysis can also be limited by the residence timescale. However, in the case of photolysis UV photons can reach disk layers below the optical τr = 1 line, due to forward scattering into the disk (van Zadelhoff et al. 2003). We calculated the height z1 of the layer exposed to UV radiation by equating tres, the residence time, with tph, the time to destroy a carbon grain entirely by photolysis: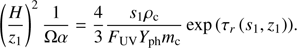 (A.8)
(A.8)
Here, the exponential factor expresses the attenuation of the UV field within the disk. Analogous to the τr = 1 constraint for the oxidation case, we use this equation to find the height of the exposed layer z1, ph, the value of the optical depth at z1, ph, τr, ph (now generally larger than unity) and the amount of exposed material Σph* = τr, phΦ/κ. Once the layer that is exposed to photolysis is thus characterised, the carbon destruction is calculated using the rates as shown in Eq. (7). Using Eq. (A.7) for the unrestricted photolyis rate, the carbon removal rate then becomes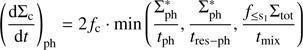 (A.9)
(A.9)
where tres − ph now follows from the solution to Eq. (A.8).
Appendix B
Radial dust transport
We used the twopoppy code by Birnstiel et al. (2012); Birnstiel15 to model the radial movement of dust grains. In this code, the dust mass is assigned to two grain sizes: small and large. The small grain radius is chosen so that the grains are well coupled to the gas. The radius of the large grains (as well as the ratio of the mass distribution) depends on the local disk conditions, is limited (mainly) by drift and fragmentation and is updated after each timestep. This makes it possible to describe the dust evolution of the disk based on two surface densities. We give here only a short overview over the most important concepts and formulas.
Assuming that the Epstein limit of the drag law applies to all relevant grain sizes in the entire disk, compact spherical grains, a self-similar gas surface density profile and an eddy turn over time of tL = 1/Ω, the Stokes number Stmid of a grain with radius s and specific density ρs at the midplane can be written as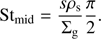 (B.1)
(B.1)
The small, well-coupled grains have a fixed radius, which we assume to be ss = 0.1 μm. The size of the large grains is limited by fragmentation and drift. The size limit due to fragmentation is given by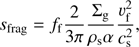 (B.2)
(B.2)
where cs is the isothermal sound speed and ff is a calibration factor of order unity, leading to grain size slightly below the fragmentation limit. The size limit due to drift is given by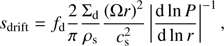 (B.3)
(B.3)
where P is the gas pressure and fd is a calibration factor similar to ff. The radius of the large grains is than chosen as sl = min(sdrift, sfrag).
In the fragmentation limited regime, the surface density fraction in large grains is fl = 0.75, and fl = 0.97 in the drift limited regime. We emphasise that these mass distributions and grain sizes are used for the radial and not the vertical dust transport. Only the maximum possible grain size smax = sl is used in the calculation of s1 and z1 in Sect. 2.2.
The radial transport of the dust can now be described by solving two advection-diffusion equations:![$ \begin{aligned} \frac{\partial \Sigma _i}{\partial t} + \frac{1}{r}\frac{\partial }{\partial r}\left[r\left(\Sigma _i v_i - D_i \Sigma _\mathrm{g} \frac{\partial }{\partial r} \left(\frac{\Sigma _i}{\Sigma _\mathrm{g}}\right)\right)\right]=0 \end{aligned} $](/articles/aa/full_html/2018/10/aa33719-18/aa33719-18-eq21.gif) (B.4)
(B.4)
where Σi is the surface density of the dust grain, vi the dust velocity due to drift and gas drag, Di the diffusivity of the species and the index i refers to the small (s) and the large (l) grains. For the small dust component vi will be equal to the gas accretion velocity while for the large component the drift velocity and the gas accreation velocity both contribute. Since the Stokes number of a grain is always smaller than unity in this model, the dust diffusivity is assumed to be equal to the gas diffusivity Dg which is considered the same as the gas viscosity.
To follow not only the dust mass and size but also the dust composition, we have modified this code. We used four instead of two types of grains, small and large carbon grains (sc, s, sc, l) and small and large silicate grains (ss, s, ss, l). As in the original code, fl is used to distribute the surface density between the particles sizes, and we use fc to distribute the surface density between the different grain species. The advection-diffusion equation for small carbon grains now includes a sink term and reads:![$ \begin{aligned} \frac{\partial \Sigma _\mathrm{c,s}}{\partial t} + \frac{1}{r}\frac{\partial }{\partial r}\left[r\left(\Sigma _\mathrm{c,s} v_\mathrm{s} - D_\mathrm{s} \Sigma _\mathrm{g} \frac{\partial }{\partial r} \left(\frac{\Sigma _\mathrm{c,s}}{\Sigma _\mathrm{g}}\right)\right)\right]= - \frac{\mathrm{d}\Sigma _\mathrm{c}}{\mathrm{d}t} . \end{aligned} $](/articles/aa/full_html/2018/10/aa33719-18/aa33719-18-eq22.gif) (B.5)
(B.5)
The advection-diffusion equation for large carbon grains has no sink term:![$ \begin{aligned} \frac{\partial \Sigma _\mathrm{c,l}}{\partial t} + \frac{1}{r}\frac{\partial }{\partial r}\left[r\left(\Sigma _\mathrm{c,l} v_\mathrm{l} - D_\mathrm{l} \Sigma _\mathrm{g} \frac{\partial }{\partial r} \left(\frac{\Sigma _\mathrm{c,l}}{\Sigma _\mathrm{g}}\right)\right)\right]= 0 . \end{aligned} $](/articles/aa/full_html/2018/10/aa33719-18/aa33719-18-eq23.gif) (B.6)
(B.6)
As in the case of large carbon grains, the advection-diffusion equations for small as well as large silicate grains do not include a sink term.
Once the advection-diffusion equation has been solved, fc is again calculated, since the radial transport of large and small grains changes the carbon distribution within the disk. By re-calculating a new common carbon fraction for both grain sizes after each timestep, we assume that coagulation and fragmentation have been efficient enough to re-distribute carbon between large and small grains. This maximises the carbon removal efficiency. This carbon fraction value is now the base for the calculation of the carbon destruction. When used in Eqs. (7) and (A.9), it does not indicate the carbon fraction in the exposed layer, but is used to calculate the total amount of carbon available in the exposed layer at the onset of oxidation or photolysis.
Through all these calculations, we assumed a constant,self-similar gas surface density profile. The surface density of the destroyed carbon is not added to the gas surface density, but completely removed from the system.
List of notations.
continued.
All Tables
Carbon fraction fc = Σc/Σtot after 1 Myr at 1 au for models limited by vertical transport and models limited by vertical and radial transport.
All Figures
|
Fig. 1. Height of the exposed layer divided by the disk radius z1/r against disk radius r. Silicate grains are plotted in grey, carbon grains in black. Large grains are settled close to the midplane. In the exposed layer above z1, carbon grains can be oxidised, indicated in red. The range of vertical dust movement is shown by blue arrows. Grains stay for tres in the exposed layer, and within tmix, material from the exposed layer is well-mixed with material from the midplane. |
| In the text | |
|
Fig. 2. Height z vs. grain radius s where τr = 1 at r = 1 au. The peak of the z coordinate of τr defines the height of the exposed layer z1 and the radius s1 up to which grains contribute to the opacity in the exposed layer (red arrows). Grains larger than s1 are too settled to contribute. The size sgeo is an upper limit for s1 as the opacity decreases with larger grain sizes. |
| In the text | |
|
Fig. 3. All panels show the carbon fraction fc = Σc/Σtot as function of disk radius r. Coloured lines show the time evolution of the carbon fraction fc in the fiducial model from 104 yr to 106 yr. The vertical line indicates Earth’s position. The horizontal dashed line shows depletion by a factor ten. Left: carbon removal by oxidation. Right: carbon removal by photolysis. Top panels: the oxidation (photolysis) fcΣ*/tox (fcΣph*/tph) is applied to the carbon in the exposed layer unrestricted by vertical or radial transport. Middle panels: vertical dust transport is taken into account as described in Eq. (7) (Eq. (A.9)). Bottom panels: vertical and radial dust transport as described in Appendix B are included. The scale of the y-axis has been changed because of the low level of carbon depletion in these models. |
| In the text | |
Current usage metrics show cumulative count of Article Views (full-text article views including HTML views, PDF and ePub downloads, according to the available data) and Abstracts Views on Vision4Press platform.
Data correspond to usage on the plateform after 2015. The current usage metrics is available 48-96 hours after online publication and is updated daily on week days.
Initial download of the metrics may take a while.