Fig. 7.
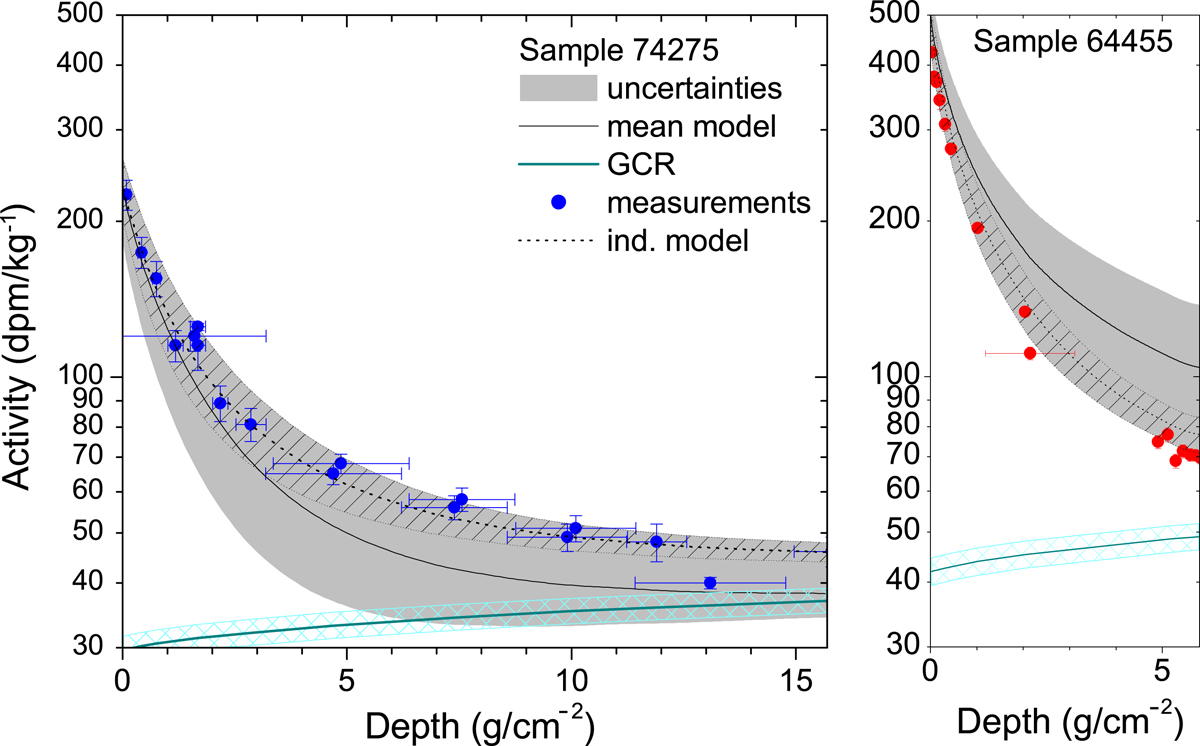
Comparison of the measured 26Al activity in the analyzed samples 74 274 (blue points in panel A, from Fink et al. 1998) and 64 455 (red points in panel B, from Nishiizumi et al. 2009) with the values computed here using the final reconstructed spectrum (Table 2 in the main text) as shown by the solid black line (the mean activity) with the full-range uncertainty (gray area). The dashed curves with the hatched areas correspond to spectra reconstructed for individual samples (Table 1). The light blue hatched area with the olive curve depicts the GCR contribution to the activity.
Current usage metrics show cumulative count of Article Views (full-text article views including HTML views, PDF and ePub downloads, according to the available data) and Abstracts Views on Vision4Press platform.
Data correspond to usage on the plateform after 2015. The current usage metrics is available 48-96 hours after online publication and is updated daily on week days.
Initial download of the metrics may take a while.