Fig. 6.
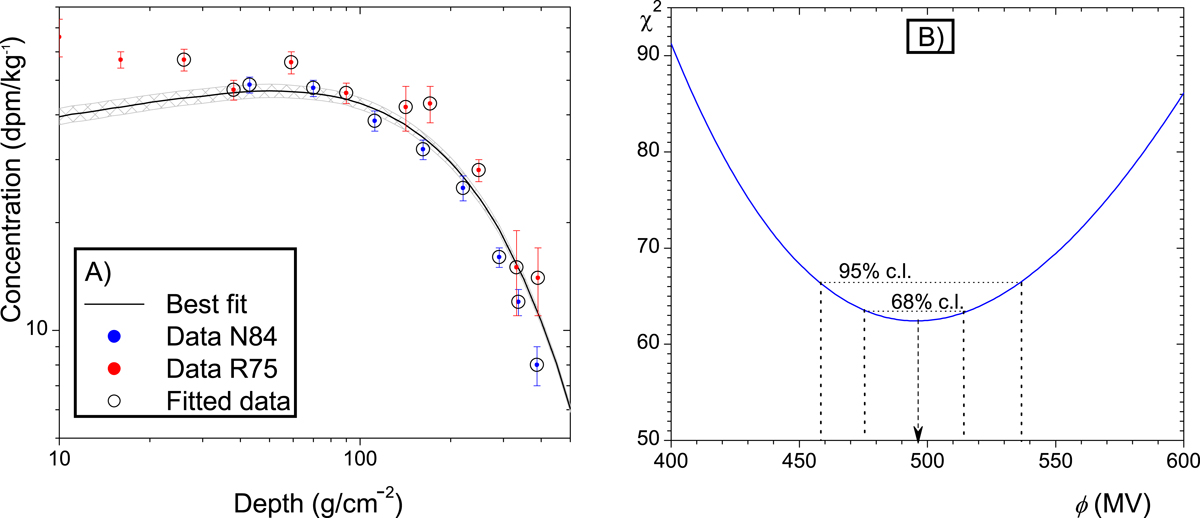
Determination of the mean GCR level. Panel A: measured (N84; Nishiizumi et al. 1984) and red (R75; Rancitelli et al. 1975) dots) and the best-fit GCR-induced activity of 26Al in the Apollo 15 deep drill core. Datapoints used for the fit are in black circles. Since activity at depths shallower than 20 g cm−2 can be affected by SEPs, shallow points were not used in the fit. The gray hatched area denotes the 68% confidence interval defined in panel B. Panel B: χ2 statistics for the fit of the modeled 26Al activity shown in Panel A as a function of the modulation potential ϕ. The best-fit
![]() value of ϕ = 496 MV is shown by the arrow, while the 68% (defined as
value of ϕ = 496 MV is shown by the arrow, while the 68% (defined as ![]() ) and 95% (
) and 95% (![]() ) confidence intervals are denoted by the dotted lines.
) confidence intervals are denoted by the dotted lines.
Current usage metrics show cumulative count of Article Views (full-text article views including HTML views, PDF and ePub downloads, according to the available data) and Abstracts Views on Vision4Press platform.
Data correspond to usage on the plateform after 2015. The current usage metrics is available 48-96 hours after online publication and is updated daily on week days.
Initial download of the metrics may take a while.