Fig. 4.
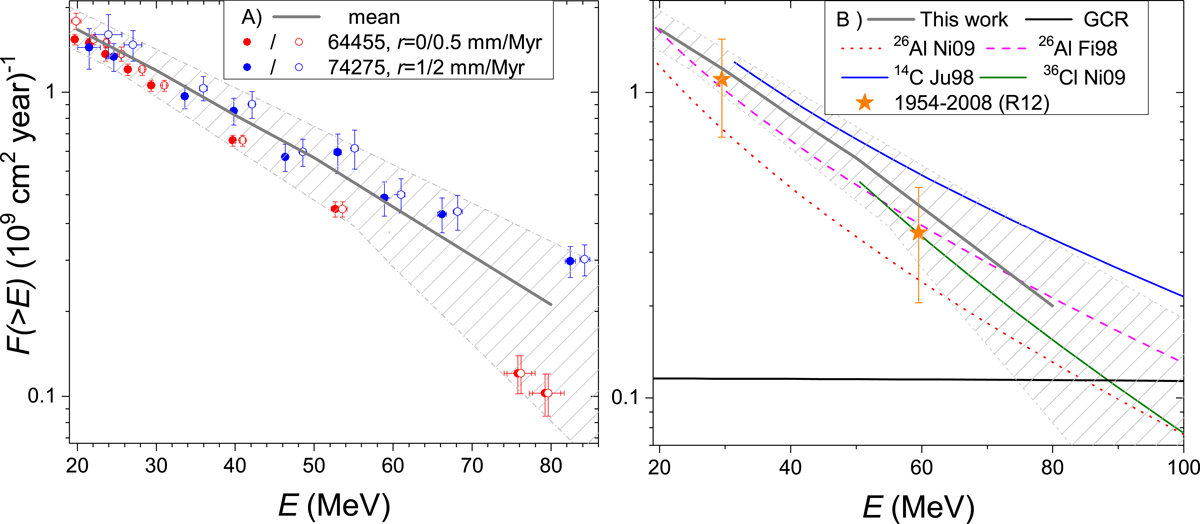
Integral omnidirectional fluxes F(>E) of solar energetic protons with energy above the given value E. Panel A: reconstruction of the million-year spectrum based on 26Al in lunar samples. The red and blue dots depict reconstructions (see Table 1) from measurements of 26Al in lunar samples 64 455 (erosion rate, r = 0 and 0.5 mm Myr−1) and 74 275 (erosion rate r = 1 and 2 mm Myr−1), respectively, as denoted in the legend. The thick line and the hatched area depict the average and the full-range uncertainties of the reconstructed fluxes for the two samples, considering all the uncertainties, including those of the erosion rate and of the spectral shape. Exact values are given in Table 2. Panel B: comparison with other spectra. The thick gray line with hatched area is the present reconstruction (identical to that in panel A). Colored lines depict earlier estimates of the SEP spectra, explicitly assuming the EXP shape (Eq. (4)), from 26Al by (Fink et al. 1998, Fi98), from 14C by (Jull et al. 1998, denoted Ju98) and from 26Al and 36Cl by (Nishiizumi et al. 2009, Ni09). The orange stars depict the mean values of F(>30 MeV) and F(>60 MeV) for the last solar cycles 1954–2008 (Reedy 2012), error bars being the standard error of the mean over individual cycles. The thick black line depicts the GCR contribution (ϕ = 496 MV).
Current usage metrics show cumulative count of Article Views (full-text article views including HTML views, PDF and ePub downloads, according to the available data) and Abstracts Views on Vision4Press platform.
Data correspond to usage on the plateform after 2015. The current usage metrics is available 48-96 hours after online publication and is updated daily on week days.
Initial download of the metrics may take a while.