Fig. 3.
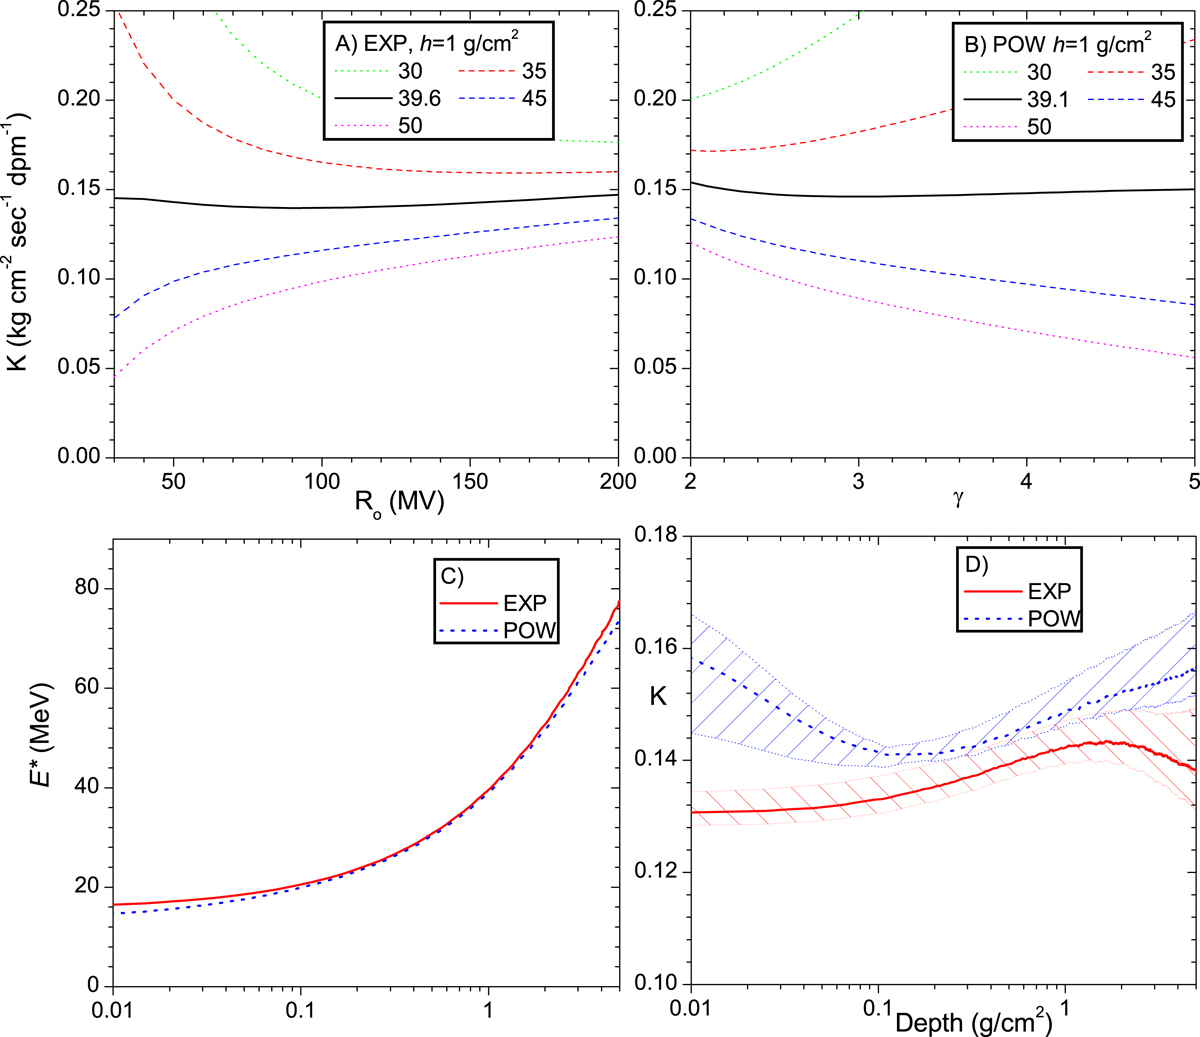
Panel A: dependence of the scaling factor K on the characteristic rigidity R 0 of the EXP model for the depth of 1 g cm−2 for different values of the effective energy E*, as denoted in the legend (in MeV). Panel B: same as A, but for the POW model with the index γ. Panel C: effective energy E* as a function of depth in lunar sample 64 455 for the EXP and POW models. Panel D: same as C, but for the best-fit scaling factor K; the hatched areas represent the full-range ΔK-values.
Current usage metrics show cumulative count of Article Views (full-text article views including HTML views, PDF and ePub downloads, according to the available data) and Abstracts Views on Vision4Press platform.
Data correspond to usage on the plateform after 2015. The current usage metrics is available 48-96 hours after online publication and is updated daily on week days.
Initial download of the metrics may take a while.