Fig. 1.
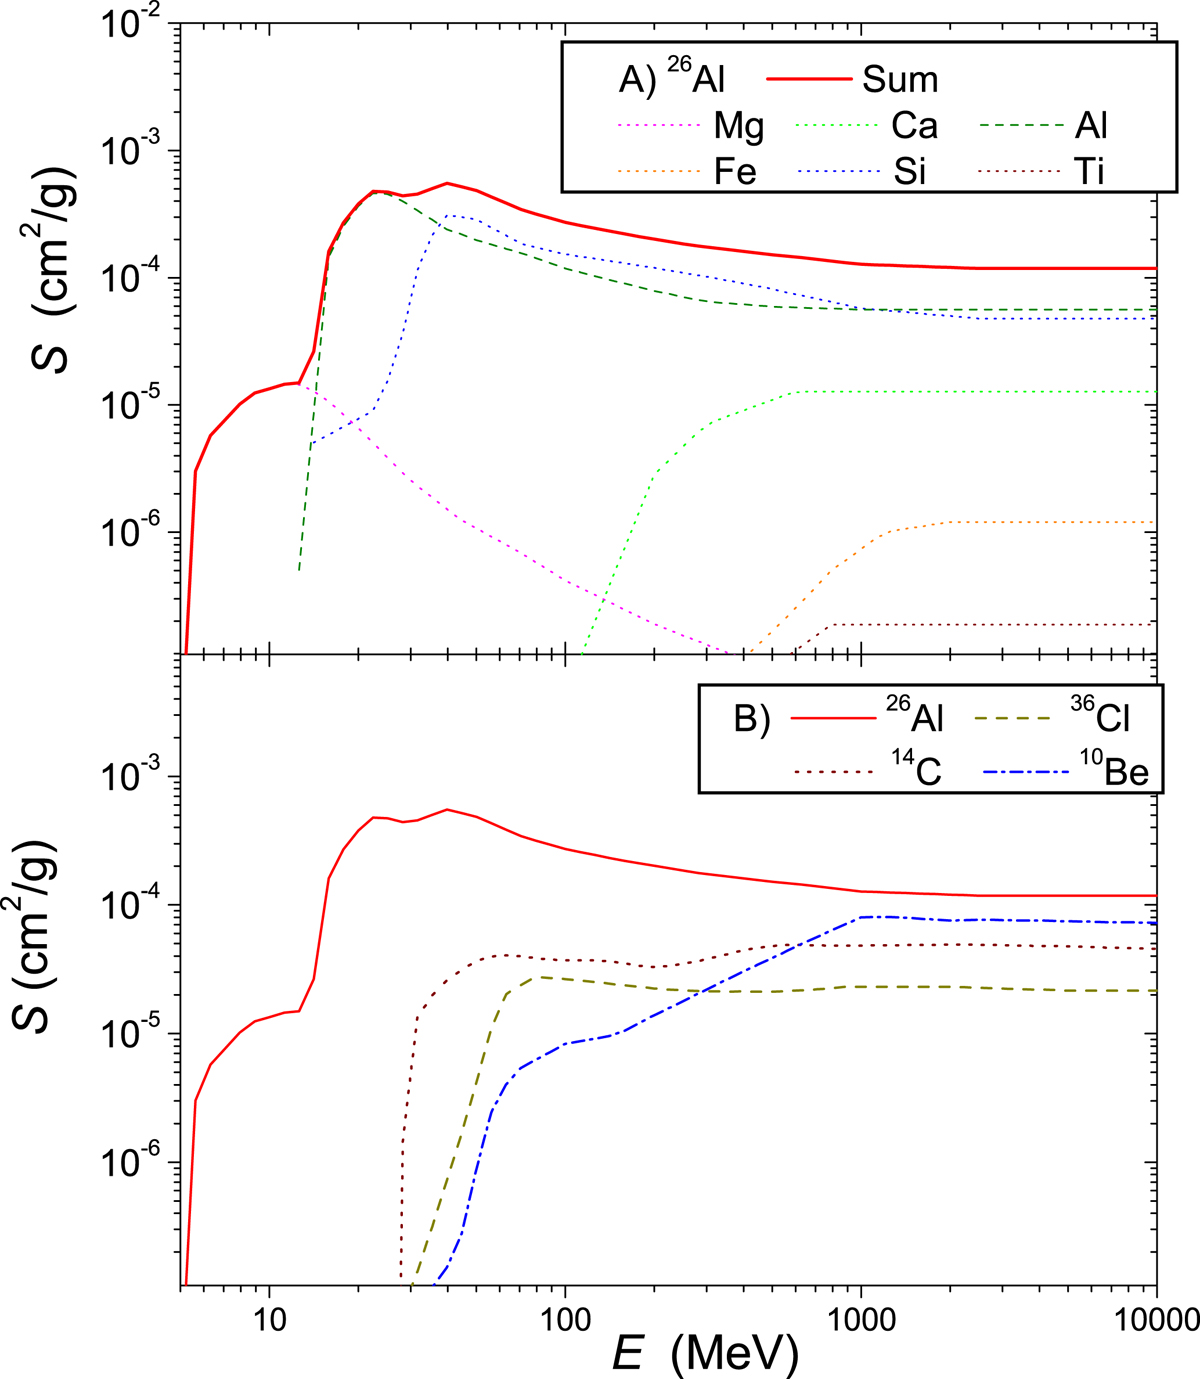
Efficiency of production (see Eq. 3) of cosmogenic isotopes by primary and secondary protons of energy E in the lunar sample 64 555, as computed here. Panel A: production of 26Al : contributions from different target nuclei are denoted by dashed lines, while the thick red curve is the total sum. Panel B: summary productions of different long-lived cosmogenic isotopes, as denoted in the legend. The red curve is identical to that in panel A.
Current usage metrics show cumulative count of Article Views (full-text article views including HTML views, PDF and ePub downloads, according to the available data) and Abstracts Views on Vision4Press platform.
Data correspond to usage on the plateform after 2015. The current usage metrics is available 48-96 hours after online publication and is updated daily on week days.
Initial download of the metrics may take a while.