Fig. 9.
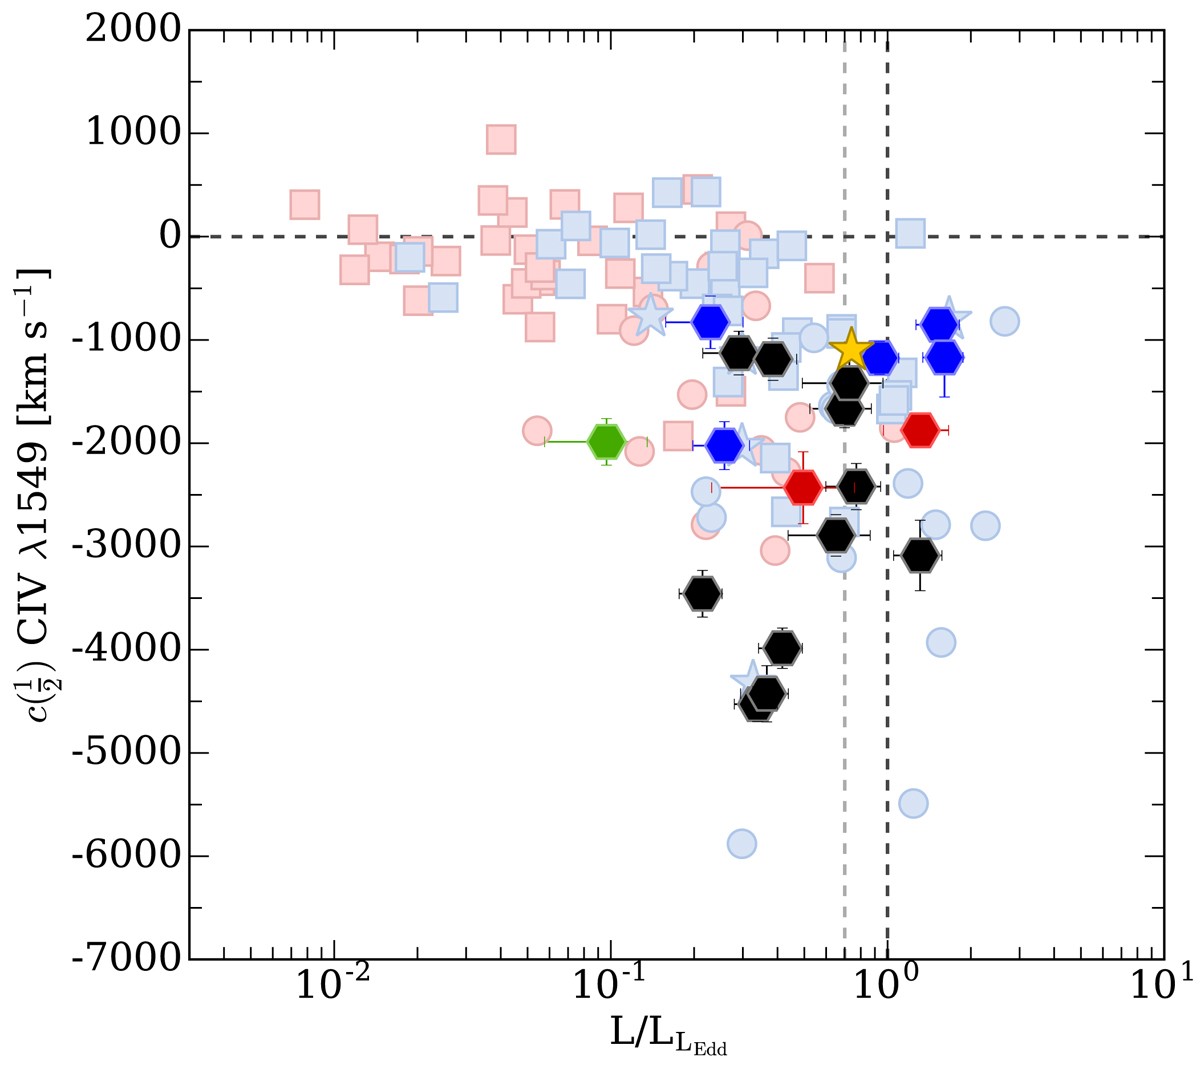
Behavior of the centroid at 1/2 of total C![]() 1549 profile as a function of Eddington ratio. Hexagons represent the GTC-xA sample. The colors of hexagons are the same as Figs. 2 and 3. Blue and red pale symbols correspond to the Population A and B, respectively. Squares and stars correspond to the FOS-A and xA samples (Sulentic et al. 2007). Circles are from HE sample Sulentic et al. (2017) sample. Yellow star marks the position of I Zw 1. The black dashed horizontal line indicates
1549 profile as a function of Eddington ratio. Hexagons represent the GTC-xA sample. The colors of hexagons are the same as Figs. 2 and 3. Blue and red pale symbols correspond to the Population A and B, respectively. Squares and stars correspond to the FOS-A and xA samples (Sulentic et al. 2007). Circles are from HE sample Sulentic et al. (2017) sample. Yellow star marks the position of I Zw 1. The black dashed horizontal line indicates ![]() km s
km s![]() . Gray and black dashed vertical lines indicate
. Gray and black dashed vertical lines indicate ![]() = 0.2 and 1.0, respectively.
= 0.2 and 1.0, respectively.
Current usage metrics show cumulative count of Article Views (full-text article views including HTML views, PDF and ePub downloads, according to the available data) and Abstracts Views on Vision4Press platform.
Data correspond to usage on the plateform after 2015. The current usage metrics is available 48-96 hours after online publication and is updated daily on week days.
Initial download of the metrics may take a while.