Fig. 8.
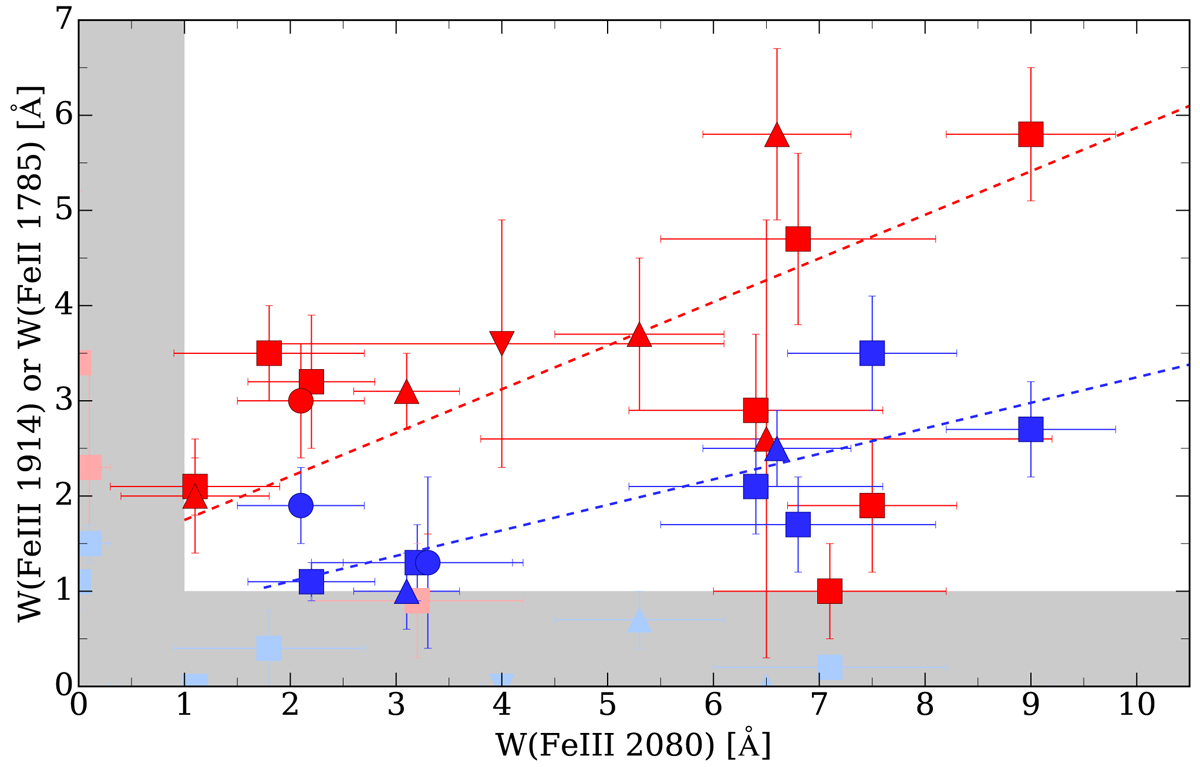
Relation between intensity of the Fe III feature at 2080 Å with Fe UV 1785 Å (blue) and Fe IIIλ1914 (red). Squares, up and down triangles, and circles mark the normal, BAL, mini–BAL and RL quasars, respectively. The gray shaded area indicates an approximate detection limit. Blue and red lines mark the orthogonal fit for each case.
Current usage metrics show cumulative count of Article Views (full-text article views including HTML views, PDF and ePub downloads, according to the available data) and Abstracts Views on Vision4Press platform.
Data correspond to usage on the plateform after 2015. The current usage metrics is available 48-96 hours after online publication and is updated daily on week days.
Initial download of the metrics may take a while.