Fig. B.1.
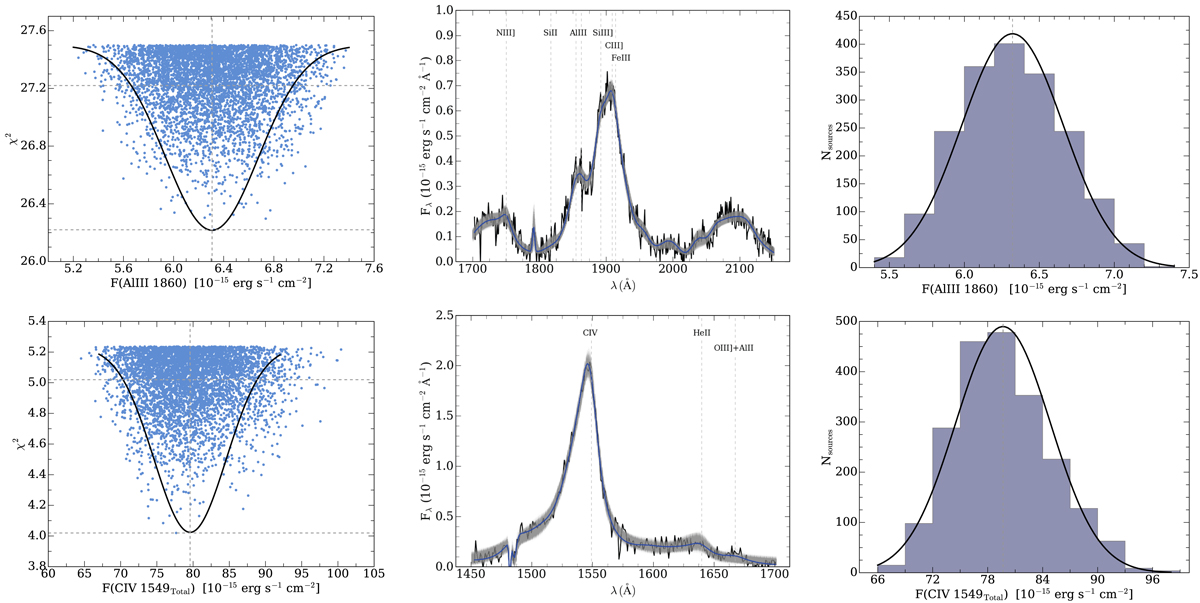
Left panels: distribution of χ2 as a function of the flux of Al III (top) and total C IV profile (bottom). Black continuous lines mark the normal distribution associated with simulations. Gray horizontal lines indicate the value at ![]() and at
and at ![]() . The gray vertical line indicates the mean of the normal distribution. Middle panels: spectra of the quasar SDSSJ222753.07-092951.7 in the 1900 Å blend (top) and total C IV
. The gray vertical line indicates the mean of the normal distribution. Middle panels: spectra of the quasar SDSSJ222753.07-092951.7 in the 1900 Å blend (top) and total C IV![]() 1549 (bottom) spectral ranges. Gray shadow regions correspond to the models at the
1549 (bottom) spectral ranges. Gray shadow regions correspond to the models at the ![]() confidence level obtained from the Monte Carlo simulations. The blue line corresponds to the SPECFIT result. Right panels show the distributions of the fluxes of Al III (top) and total C IV (bottom) for all the models under the 1σ confidence level plotted in the left panels. Vertical lines has the same meaning as in left panels.
confidence level obtained from the Monte Carlo simulations. The blue line corresponds to the SPECFIT result. Right panels show the distributions of the fluxes of Al III (top) and total C IV (bottom) for all the models under the 1σ confidence level plotted in the left panels. Vertical lines has the same meaning as in left panels.
Current usage metrics show cumulative count of Article Views (full-text article views including HTML views, PDF and ePub downloads, according to the available data) and Abstracts Views on Vision4Press platform.
Data correspond to usage on the plateform after 2015. The current usage metrics is available 48-96 hours after online publication and is updated daily on week days.
Initial download of the metrics may take a while.