Fig. 2.
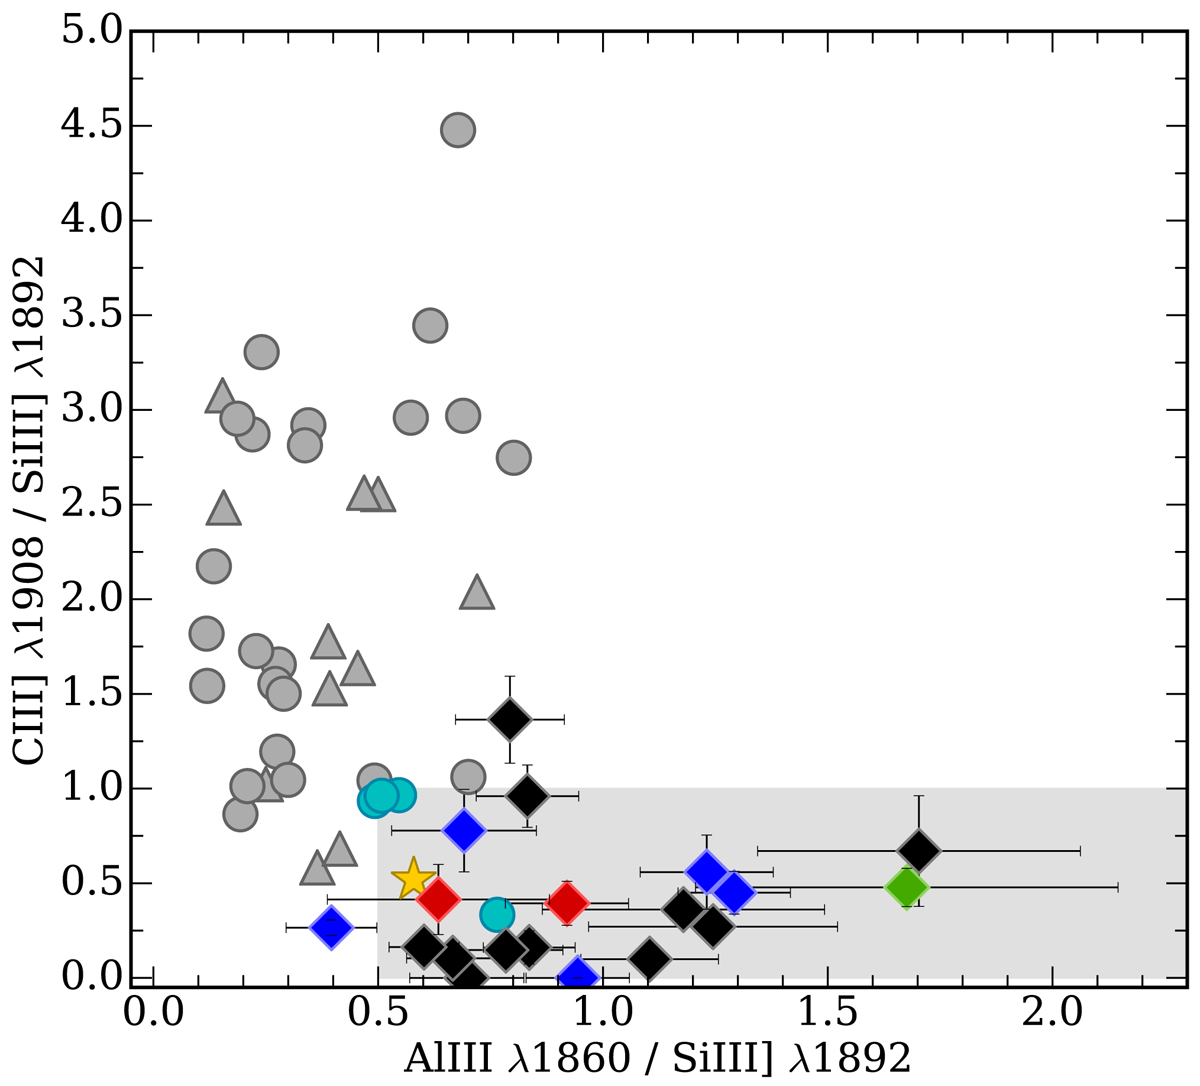
Relation between intensity ratios Al IIIλ1860/Si III![]() 1892 and C III]
1892 and C III]![]() 1909/Si III]
1909/Si III]![]() 1892. Black, blue, green and red diamonds correspond to normal, BAL, mini–BAL and Radio–Loud quasars respectively for the present GTC-xA sample. Gray and cyan dots correspond to the FOS-A and FOS-xA sample respectively. Gray triangles correspond to S14-A sample. Yellow star marks the position of I Zw 1. Gray area represents the parameter space occupied by xA sources.
1892. Black, blue, green and red diamonds correspond to normal, BAL, mini–BAL and Radio–Loud quasars respectively for the present GTC-xA sample. Gray and cyan dots correspond to the FOS-A and FOS-xA sample respectively. Gray triangles correspond to S14-A sample. Yellow star marks the position of I Zw 1. Gray area represents the parameter space occupied by xA sources.
Current usage metrics show cumulative count of Article Views (full-text article views including HTML views, PDF and ePub downloads, according to the available data) and Abstracts Views on Vision4Press platform.
Data correspond to usage on the plateform after 2015. The current usage metrics is available 48-96 hours after online publication and is updated daily on week days.
Initial download of the metrics may take a while.