Fig. A.1.
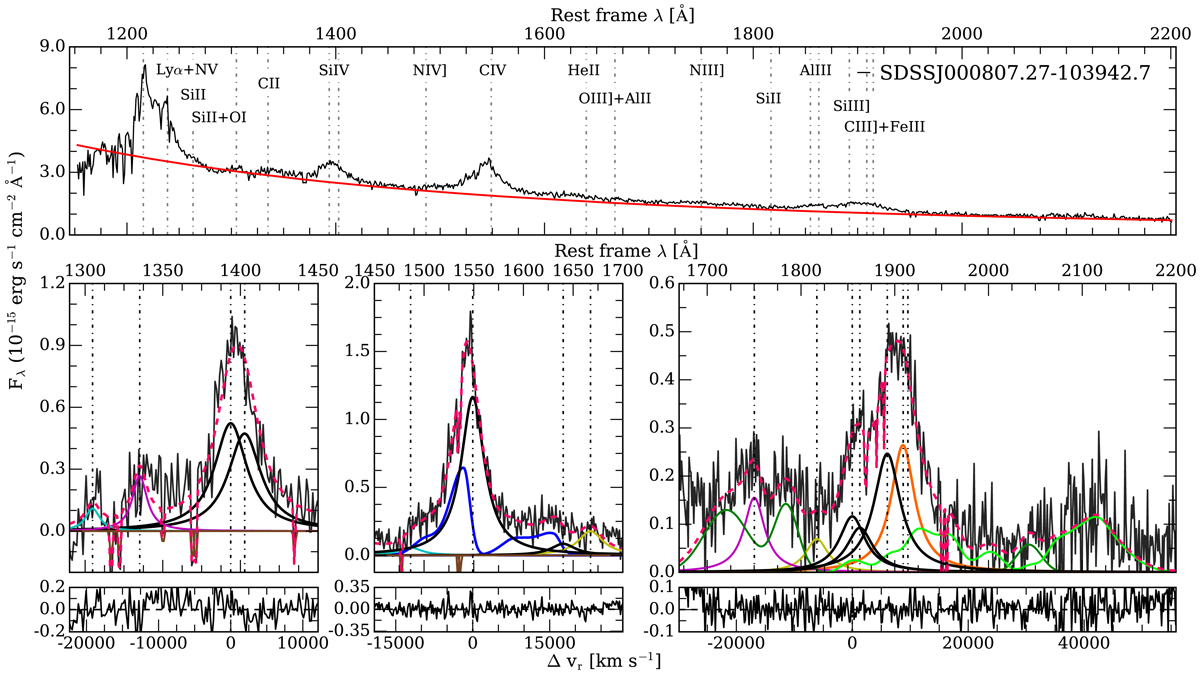
Top panel: calibrated rest-frame spectrum of SDSS000807.27-103942.7 before continuum substraction. Abscissa is rest-frame wavelength in Å, while ordinate is specific flux in units 10−15 erg s−1 cm−2 Hz−1. Global or local continuum are specified by a continuous line. Dot-dashed vertical lines identify the position at rest-frame of the strongest emission lines. Bottom panel: multicomponent fits after continuum subtraction for the Si IV![]() 1397, C IV
1397, C IV![]() 1549 and 1900 Å blend spectral ranges. In all the panels the continuous black line marks the broad component at rest-frame associated to Si IV
1549 and 1900 Å blend spectral ranges. In all the panels the continuous black line marks the broad component at rest-frame associated to Si IV![]() 1397, C IV
1397, C IV![]() 1549, Al IIIλ1860 and Si III]
1549, Al IIIλ1860 and Si III]![]() 1892 respectively, while the blue one corresponds to the blueshifted component associated to each emission. Dashed pink line marks the fit to the whole spectrum. Absorption lines are indicated by a brown line. Dot-dashed vertical lines correspond to the rest-frame of each emission line. In the Si IV
1892 respectively, while the blue one corresponds to the blueshifted component associated to each emission. Dashed pink line marks the fit to the whole spectrum. Absorption lines are indicated by a brown line. Dot-dashed vertical lines correspond to the rest-frame of each emission line. In the Si IV![]() 1397 spectral range, the cyan line marks the contribution of O I + S II 1304 blend, while the magenta line corresponds to the C II
1397 spectral range, the cyan line marks the contribution of O I + S II 1304 blend, while the magenta line corresponds to the C II![]() 1335 emission line. In the C IV
1335 emission line. In the C IV![]() 1549 region, N IV
1549 region, N IV![]() 1486 is represented by a cyan line, while the yellow one corresponds to the O III
1486 is represented by a cyan line, while the yellow one corresponds to the O III![]() 1663 + Al II
1663 + Al II![]() 1670 blend. In the 1900 Å blend range, Fe III and Fe II contributions are traced by dark and pale green lines respectively, magenta lines marks the N III]
1670 blend. In the 1900 Å blend range, Fe III and Fe II contributions are traced by dark and pale green lines respectively, magenta lines marks the N III]![]() 1750 and the yellow one corresponds to the Si III
1750 and the yellow one corresponds to the Si III![]() 1816. Lower panels correspond to the residuals, abscissa is in radial velocity units km s
1816. Lower panels correspond to the residuals, abscissa is in radial velocity units km s![]() .
.
Current usage metrics show cumulative count of Article Views (full-text article views including HTML views, PDF and ePub downloads, according to the available data) and Abstracts Views on Vision4Press platform.
Data correspond to usage on the plateform after 2015. The current usage metrics is available 48-96 hours after online publication and is updated daily on week days.
Initial download of the metrics may take a while.