Fig. 6
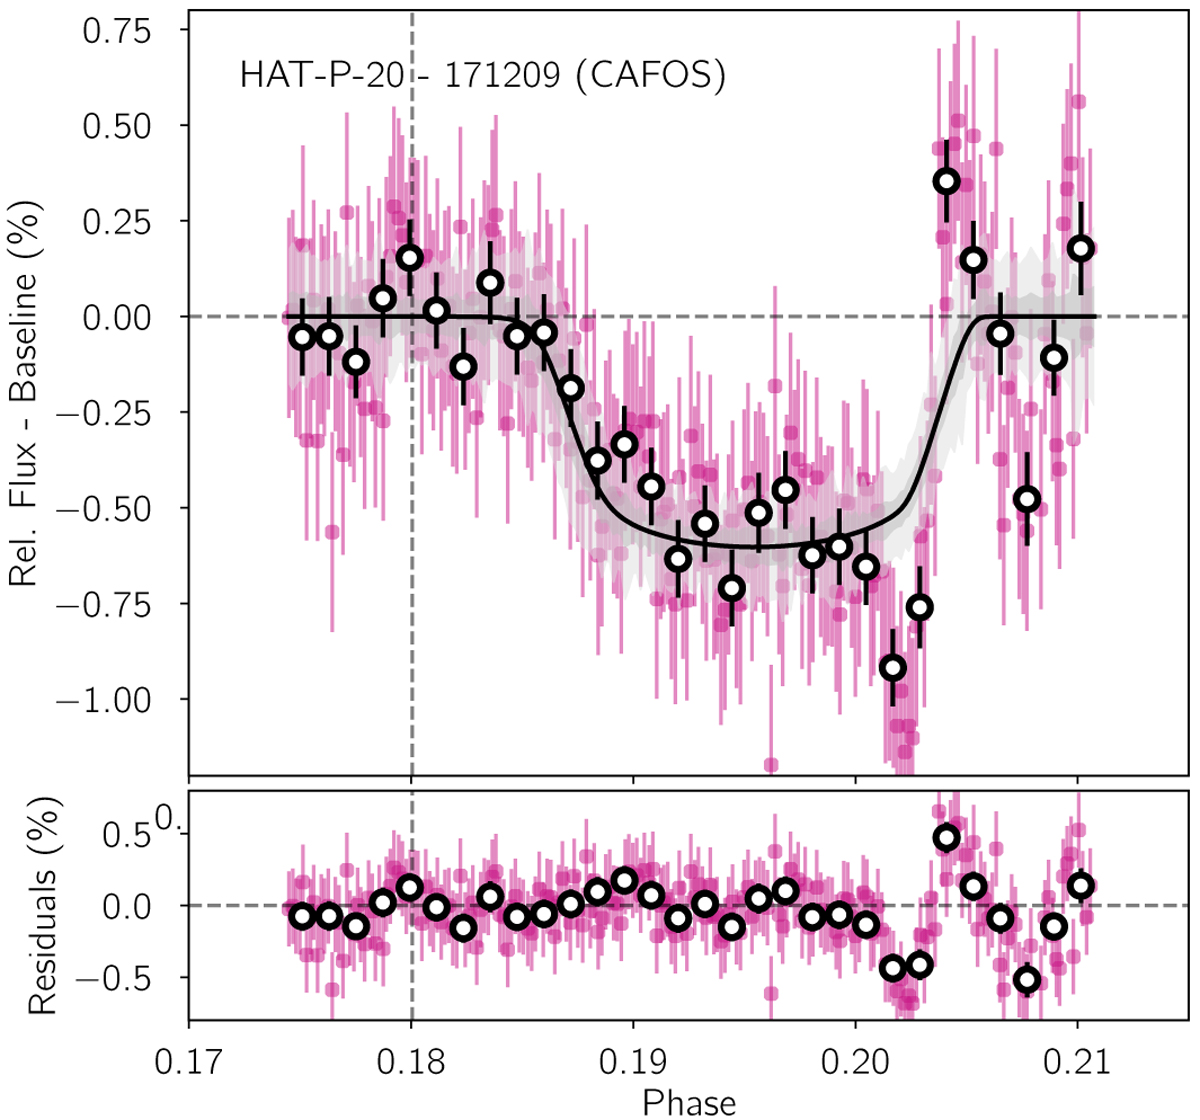
Trojan hypothesis model after removing the linear baseline model for HAT-P-20. This trojan model is only favored against the null hypothesis if we include the whole data set. However by removing the feature at phases ϕ > 0.20, the null hypothesis is favored. The black shaded vertical line represents the expected egress of the Lagrangian point, showing thelarge time lag of the would-be trojan transit. This light curve corresponds to the data from CAFOS at CAHA on 2017-12-09.
Current usage metrics show cumulative count of Article Views (full-text article views including HTML views, PDF and ePub downloads, according to the available data) and Abstracts Views on Vision4Press platform.
Data correspond to usage on the plateform after 2015. The current usage metrics is available 48-96 hours after online publication and is updated daily on week days.
Initial download of the metrics may take a while.