Fig. 4
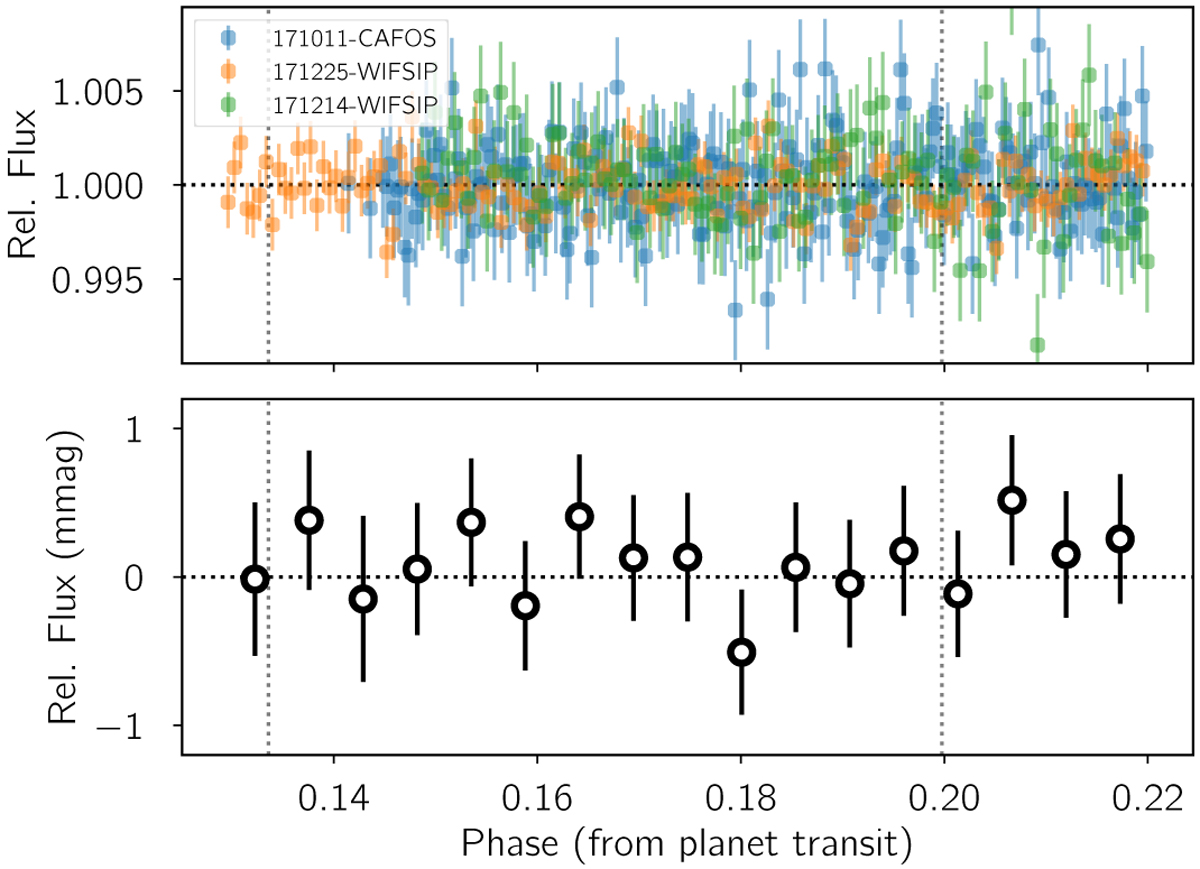
Example of the light curve combination in phase for the case of WASP-77A. The individual epochs are shown in the top panel (after removing the linear baseline model) and the combined light curve is shown in the bottom panel; 10 min bins have 225 ppm rms. The vertical dotted lines indicate the expected transit ingress and egress of the Lagrangian point.
Current usage metrics show cumulative count of Article Views (full-text article views including HTML views, PDF and ePub downloads, according to the available data) and Abstracts Views on Vision4Press platform.
Data correspond to usage on the plateform after 2015. The current usage metrics is available 48-96 hours after online publication and is updated daily on week days.
Initial download of the metrics may take a while.