Fig. 3
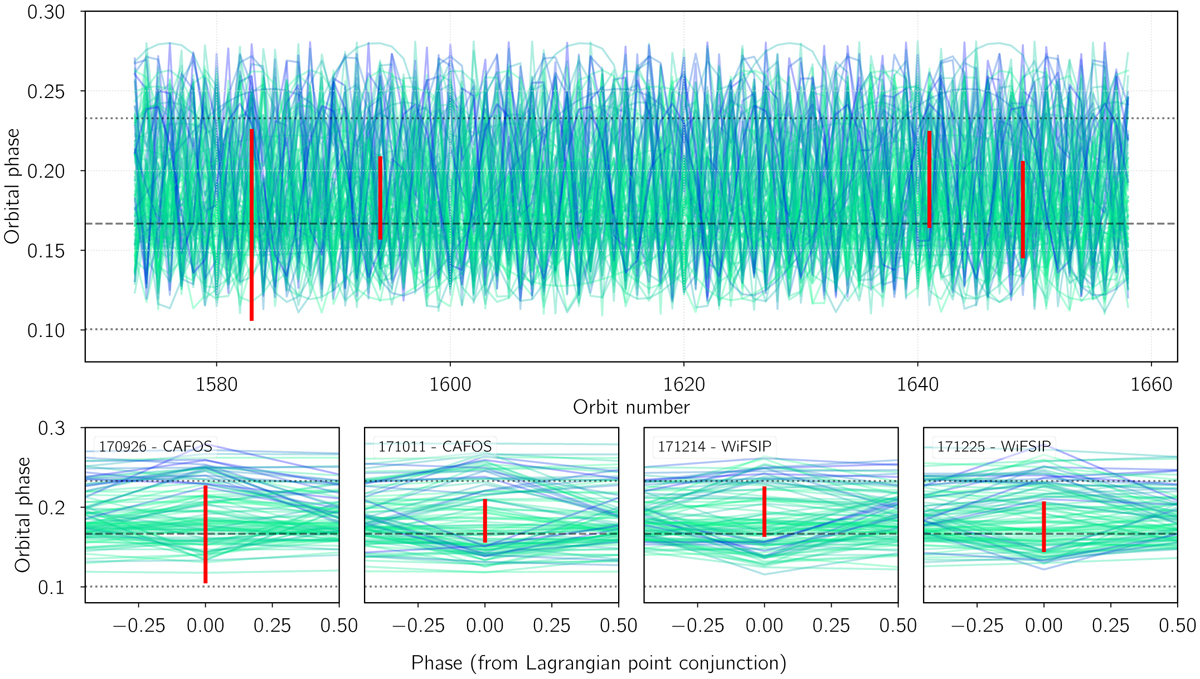
Example of the analysis of the parameter space constrain based on the non-detection of transits in our data for the system WASP-77A. Top panel: orbit number (X-axis) vs. the orbital phase covered by our observations (red vertical lines). The transit of the Lagrangian point (L5 in this case) is expected to happen between the dotted horizontal lines. The colored lines represent a small sample of the accepted models. For a model to be accepted it has to either not cross the red lines if the trial trojan radius is larger than the light curve detectability limit (blue lines) or if the trojan transits during our observations but is smaller than the detectability limit (green lines). The bottom panels are just close views on each of the four epochs, where the X-axis is the phase from the Lagrangian point conjunction.
Current usage metrics show cumulative count of Article Views (full-text article views including HTML views, PDF and ePub downloads, according to the available data) and Abstracts Views on Vision4Press platform.
Data correspond to usage on the plateform after 2015. The current usage metrics is available 48-96 hours after online publication and is updated daily on week days.
Initial download of the metrics may take a while.