Fig. 2
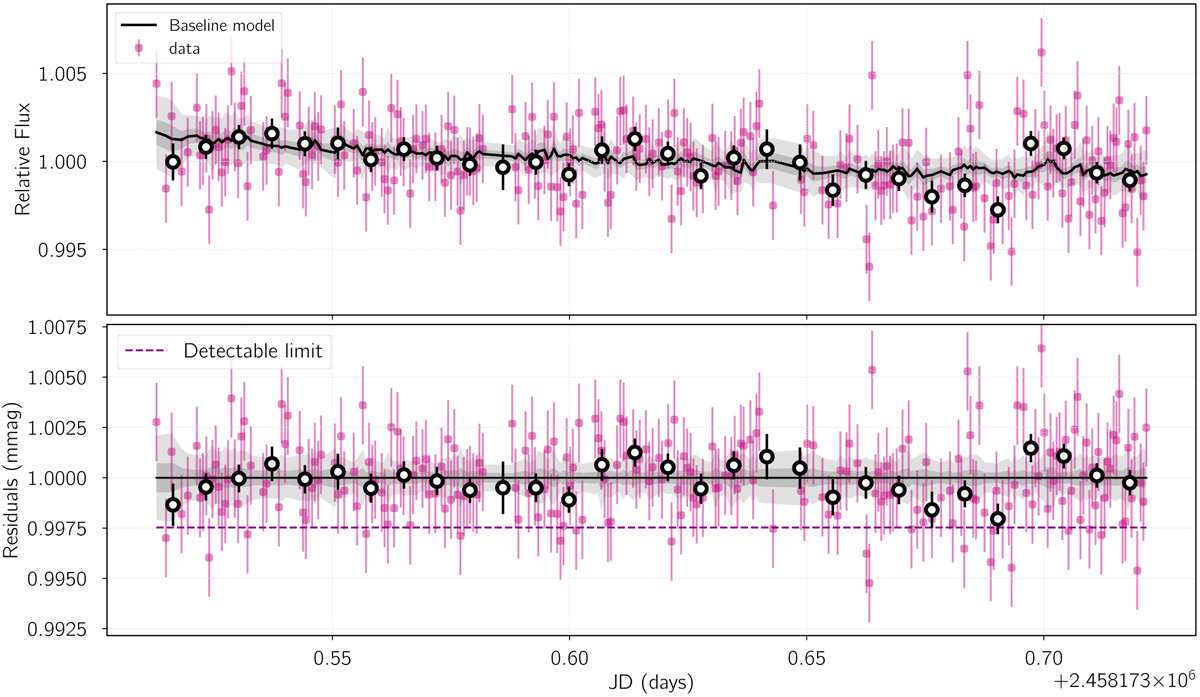
Example of the light curve analysis of the L5 region of HAT-P-36 b (observed with CAFOS on 2018-03-22) including the linear baseline model (see Sect. 3.2.1). Top panel: raw light curve (violet symbols) together with the 15 min binned data (black open circles, for visualization purposes) and the baseline model fitted. In this case, we assume to trojan (null hypothesis). Bottom panel: baseline-corrected light curve with the detectable limit calculated as the 95% interval for the Rt ∕R⋆ parameter in the trojan model. In both panels, the shaded regions correspond to the 68.7% and 99.7% confidence intervals.
Current usage metrics show cumulative count of Article Views (full-text article views including HTML views, PDF and ePub downloads, according to the available data) and Abstracts Views on Vision4Press platform.
Data correspond to usage on the plateform after 2015. The current usage metrics is available 48-96 hours after online publication and is updated daily on week days.
Initial download of the metrics may take a while.