Fig. A.3
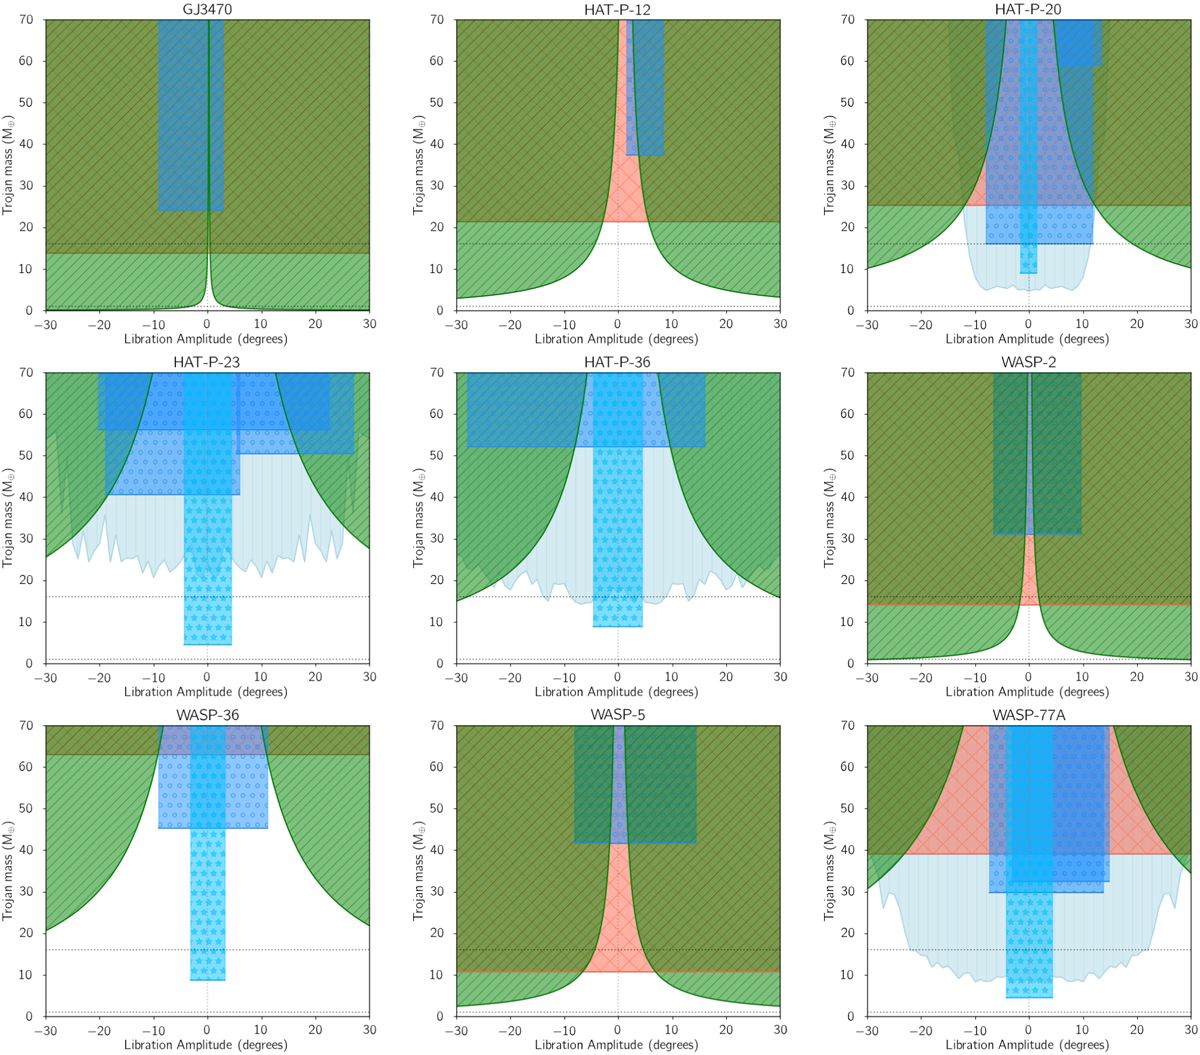
Constraint of the trojan mass vs. libration amplitude parameter space based on the three techniques used in this paper. The constraint from individual transits is shown as blue shaded regions with open circles, the constraint from the combined light curve is shown in light blue with open star symbols, the constraint from TTVs is shown as green diagonally striped shaded region, and the radial velocity constraint is shown as a red vertically striped shaded region. The two horizontal dotted lines represent the Earth and Neptune and are shown to guide the eye.
Current usage metrics show cumulative count of Article Views (full-text article views including HTML views, PDF and ePub downloads, according to the available data) and Abstracts Views on Vision4Press platform.
Data correspond to usage on the plateform after 2015. The current usage metrics is available 48-96 hours after online publication and is updated daily on week days.
Initial download of the metrics may take a while.