Fig. A.2
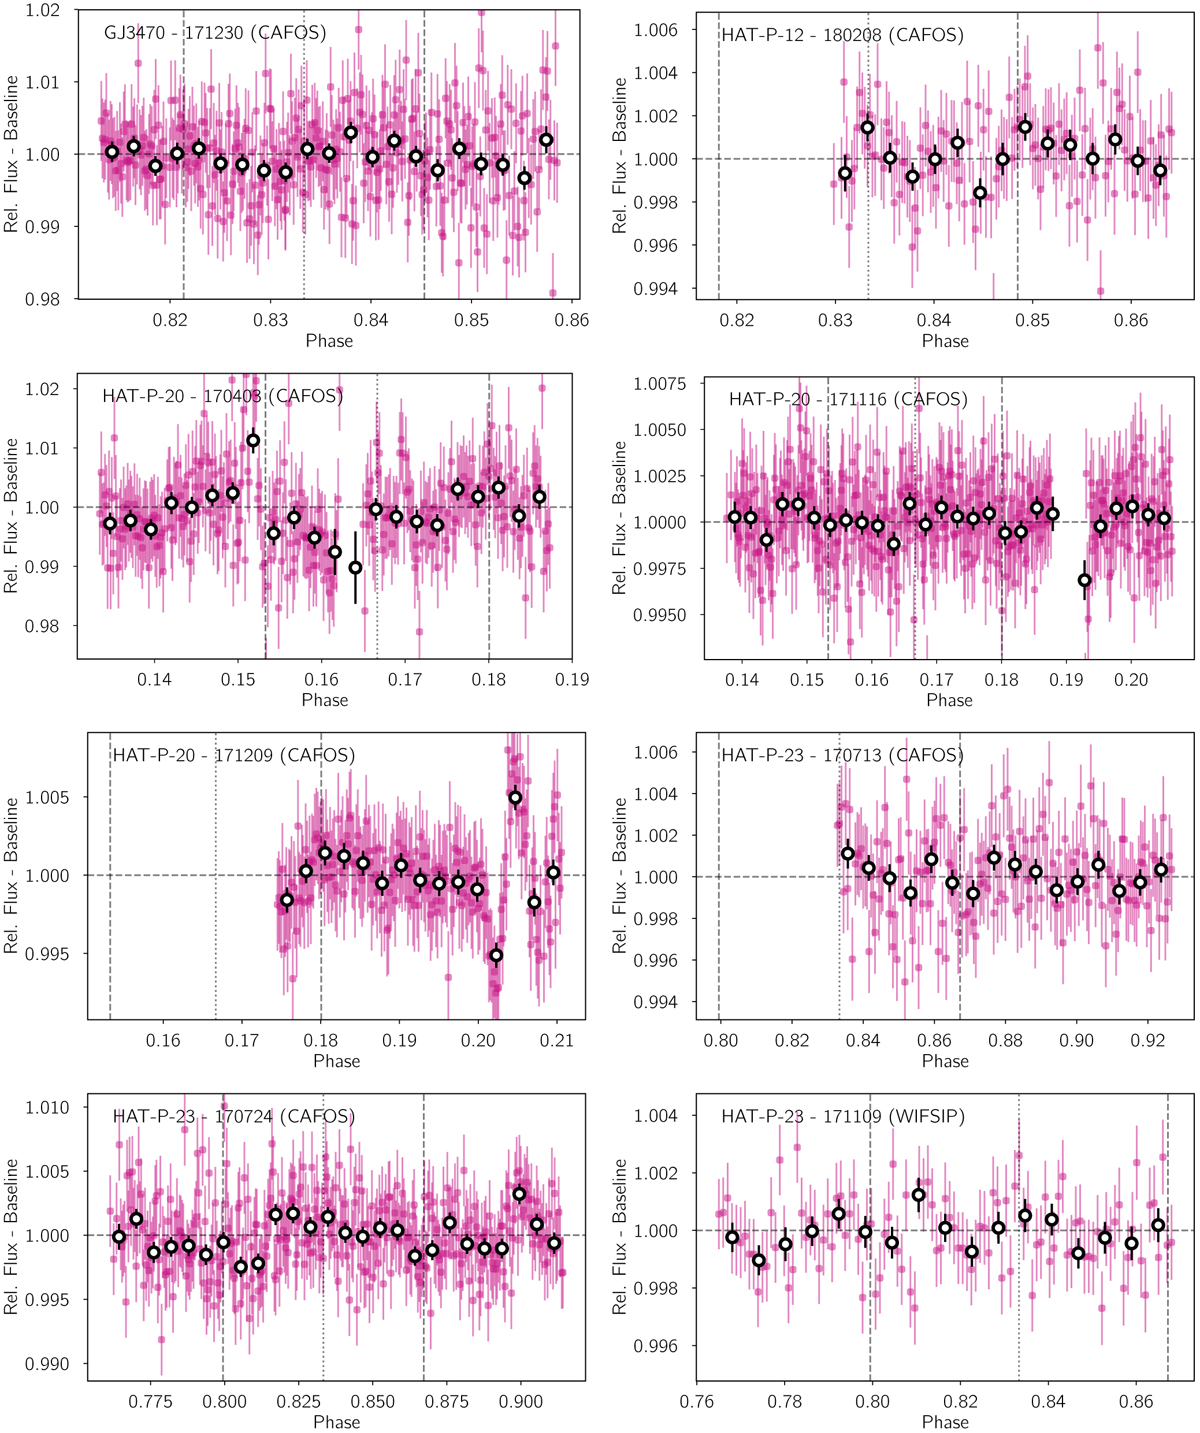
Light curves of all Lagrangian point transits observed with ground-based facilities. A linear baseline model accounting for time, seeing, airmass, XY positions on the detector, and background has been removed. Purple data points are the individual measurements while big black open symbols represent 10 min bins. The system and observing date (in YYMMDD format) are shown in each panel. The vertical dashed line indicates the mid-transit passage of the Lagrangian point and the dotted vertical lines indicate the total duration of the transit assuming the same as the planet.
Current usage metrics show cumulative count of Article Views (full-text article views including HTML views, PDF and ePub downloads, according to the available data) and Abstracts Views on Vision4Press platform.
Data correspond to usage on the plateform after 2015. The current usage metrics is available 48-96 hours after online publication and is updated daily on week days.
Initial download of the metrics may take a while.