| Issue |
A&A
Volume 618, October 2018
|
|
|---|---|---|
| Article Number | A11 | |
| Number of page(s) | 11 | |
| Section | Interstellar and circumstellar matter | |
| DOI | https://doi.org/10.1051/0004-6361/201833175 | |
| Published online | 03 October 2018 | |
Linking interstellar and cometary O2: a deep search for 16O18O in the solar-type protostar IRAS 16293–2422
1
INAF, Osservatorio Astrofisico di Arcetri,
Largo E. Fermi 5,
50125
Firenze, Italy
e-mail: This email address is being protected from spambots. You need JavaScript enabled to view it.
2
Leiden Observatory, Leiden University,
PO Box 9531,
2300
RA Leiden, The Netherlands
3
Max-Planck-Institut für Extraterretrische Physik,
Giessenbachstrasse 1,
85748
Garching, Germany
4
Centre for Star and Planet Formation, Niels Bohr Institute & Natural History Museum of Denmark, University of Copenhagen,
Øster Voldgade 5–7,
1350
Copenhagen K., Denmark
5
I. Physikalisches Institut, Universität zu Köln,
Zülpicher Str. 77,
50937
Köln, Germany
6
Physikalisches Institut, Universität Bern,
Sidlerstrasse 5,
3012
Bern, Switzerland
7
Climate and Space Sciences and Engineering, University of Michigan,
Ann Arbor,
MI 48109, USA
8
Laboratoire d’Astrophysique de Bordeaux, Univ. Bordeaux, CNRS, B18N, Allée Geoffroy Saint-Hilaire,
33615
Pessac, France
9
Center for Space and Habitability, University of Bern,
Gesellschaftsstrasse 6,
3012
Bern, Switzerland
10
Center for Computer Sciences, University of Tsukuba,
305-8577
Tsukuba, Japan
11
Department of Space, Earth, and Environment, Chalmers University of Technology, Onsala Space Observatory,
43992
Onsala, Sweden
12
School of Physics and Astronomy, University of Leeds,
Leeds
LS2 9JT, UK
Received:
6
April
2018
Accepted:
31
May
2018
Abstract
Recent measurements carried out at comet 67P/Churyumov–Gerasimenko (67P) with the Rosetta probe revealed that molecular oxygen, O2, is the fourth most abundant molecule in comets. Models show that O2 is likely of primordial nature, coming from the interstellar cloud from which our solar system was formed. However, gaseous O2 is an elusive molecule in the interstellar medium with only one detection towards quiescent molecular clouds, in the ρ Oph A core. We perform a deep search for molecular oxygen, through the 21−01 rotational transition at 234 GHz of its 16O18O isotopologue, towards the warm compact gas surrounding the nearby Class 0 protostar IRAS 16293–2422 B with the ALMA interferometer. We also look for the chemical daughters of O2, HO2, and H2O2. Unfortunately, the H2O2 rotational transition is dominated by ethylene oxide c-C2H4O while HO2 is not detected. The targeted 16O18O transition is surrounded by two brighter transitions at ± 1 km s−1 relative to the expected 16O18O transition frequency. After subtraction of these two transitions, residual emission at a 3σ level remains, but with a velocity offset of 0.3−0.5 km s−1 relative to the source velocity, rendering the detection “tentative”. We derive the O2 column density for two excitation temperatures Tex of 125 and 300 K, as indicated by other molecules, in order to compare the O2 abundance between IRAS 16293 and comet 67P. Assuming that 16O18O is not detected and using methanol CH3OH as a reference species, we obtain a [O2]/[CH3OH] abundance ratio lower than 2−5, depending on the assumed Tex, a three to four times lower abundance than the [O2]/[CH3OH] ratio of 5−15 found in comet 67P. Such a low O2 abundance could be explained by the lower temperature of the dense cloud precursor of IRAS 16293 with respect to the one at the origin of our solar system that prevented efficient formation of O2 in interstellar ices.
Key words: astrochemistry / molecular processes / stars: formation / ISM: abundances / ISM: molecules / ISM: individual objects: IRAS 16293–2422
© ESO 2018
1 Introduction
Molecular oxygen, O2, has recently been detected in surprisingly large quantities towards solar system comets. Bieler et al. (2015) first detected O2 in comet 67P/Churyumov–Gerasimenko (hereinafter 67P) with the mass spectrometer ROSINA (Rosetta Orbiter Spectrometer for Ion and Neutral Analysis) on the Rosetta probe and derived an averaged high abundance of 3.80 ± 0.85% relative to water. This surprising detection has since been confirmed by ultraviolet (UV) spectroscopy in absorption by Keeney et al. (2017) using the Alice far-ultraviolet (FUV) spectrograph with an even higher abundance of 11−68% (with a median value of 25%). A re-analysis of the data from the Neutral Mass Spectrometer on board the Giotto mission, which did a fly-by of comet 1P/Halley in 1986, allowed Rubin et al. (2015b) to confirm the presence of O2 at similar levels to that seen in comet 67P by ROSINA. All these detections therefore suggest that O2 should be abundantly present in both Jupiter-family comets, such as 67P, and Oort Cloud comets, such as 1P/Halley, which have different dynamical behaviours and histories.
The ROSINA instrument not only revealed a high abundance of molecular oxygen but also that the O2 signal is strongly correlated with water, unlike other di-atomic species with similar volatilities such as N2 or CO (Bieler et al. 2015; Rubin et al. 2015a). Bieler et al. (2015) therefore claimed that gas-phase chemistry is not responsible for the detection of O2. Instead, the detected O2 should come from the sublimation of O2 ice trapped within the bulk H2O ice matrix suggesting that O2 was present in ice mantles before the formation of comet 67P in the presolar nebula. Several explanations have been suggested to explain the presence of O2 in comets. Taquet et al. (2016) explored different scenarios to explain the high abundance of O2, its strong correlation with water, and the low abundance of the chemically related species H2 O2, HO2, and O3. They show that formation of solid O2 together with water through surface chemistry in a dense (i.e. nH ~ 106 cm−3) and relatively warm (T ~ 20 K) dark cloud followed by the survival of this O2 –H2O ice matrix in the pre-solar and solar nebulae could explain all the constraints given by Rosetta. Such elevated temperatures are needed to enhance the surface diffusion of O atoms that recombine to form solid O2 and to limit the lifetime of atomic H on grains and prevent the hydrogenation of O2. Mousis et al. (2016) developed a toy model in which O2 is only formed through the radiolysis of H2O, and showed that O2 can be formed in high abundances (i.e. [O2]/[H2O] ≥ 1%) in dark clouds. However, laboratory experiments demonstrate that the production of O2 through radiolysis should be accompanied by an even more efficient production of H2 O2 (Zheng et al. 2006) contradicting the low [H2 O2]/[O2] abundance ratio of (0.6 ± 0.07) × 10−3 measured by Rosetta in comet 67P. Dulieu et al. (2017) experimentally showed that O2 can be produced during the evaporation of a H2 O–H2O2 ice mixturethrough the dismutation of H2 O2. However, although O2 is produced in large quantities in these experiments, the dismutation is not efficient enough to explain the low abundance of H2 O2 relative to O2 measured by Bieler et al. (2015).
If the Taquet et al. (2016) explanation holds, O2 should be detectable in molecular clouds. However, O2 is known to be an elusive molecule in the interstellar medium. Recent high-sensitivity observations with the Herschel Space Observatory allowed for deep searches of O2 in dark clouds and solar systemprogenitors. O2 has been detected towards only two sources: the massive Orion star-forming region (O2 /H2 ~ 0.3−7.3 × 10⁻⁶; Goldsmith et al. 2011; Chen et al. 2014) and the low-mass dense core ρ Oph A located in the Ophiucus molecular cloud (O2 /H2 ~ 5 × 10⁻⁸; Larsson et al. 2007; Liseau et al. 2012). Interestingly, with a high density nH of ~ 106 cm−3 and a warm temperature T of ~ 24−30 K, ρ Oph A presents exactly the physical conditions invoked by Taquet et al. (2016) to trigger efficient formation of O2 in ices.
However, O2 has yet to be found in solar system progenitors. A deep search for O2 towards the low-mass protostar NGC 1333–IRAS 4A located in the Perseus molecular cloud by Yıldiz et al. (2013) using Herschel only resulted in an upper limit on the O2 abundance ([O2]/[H2] < 6 × 10⁻⁹). The search for O2 towards NGC 1333–IRAS 4A using Herschel suffered from a high beam dilution due to the large beam of the telescope at the frequency of the targeted O2 transition (44′′ at 487 GHz) with respect to the expected emission size (a few arcseconds). In addition, NGC 1333–IRAS 4A is located in the relatively cold Perseus molecular cloud. Dust temperature maps of Perseus obtained from PACS and SPIRE observations using Herschel as part of the Gould Belt survey (André et al. 2010) suggest a dust temperature of ~ 13−14 K in the NGC 1333 star-forming region.
In this work, we present deep high-angular-resolution observations of 16O18O towards the brightest low-mass binary protostellar system IRAS 16293–2422 (hereafter IRAS 16293) with the Atacama Large Millimeter/submillimeter Array (ALMA). As the main isotopologue of molecular oxygen is almost unobservable from the ground due to atmospheric absorption, we targeted its 16O18O isotopologue through its 21−01 rotational transition at 233.946 GHz (Eup = 11.2 K, Ai,j = 1.3 × 10⁻⁸ s−1). This transition has been looked for by Goldsmith et al (1985) and Liszt et al. (1985) towards a sample of molecular clouds resulting in upper limits with respect to CO of the order of unity. The angular resolution is about 0.′′5, which is comparable to the emission size of most molecular transitions observed towards the binary system (Baryshev et al. 2015; Jørgensen et al. 2016). We also targeted transitions from the chemical “daughter” species of O2, HO2, and H2 O2, thought to be formed at the surface of interstellar ices through hydrogenation of O2. In addition to being closer (141 vs. 235 pc; Hirota et al. 2008; Ortiz-Leon et al. 2017) and more luminous (21 vs. 9.1 L⊙; Jørgensen et al. 2005; Karska et al. 2013) than NGC 1333–IRAS 4A, IRAS 16293 is located in the same molecular cloud as ρ Oph A, Ophiuchus. IRAS 16293 is therefore located in a slightly warmer environment with a dust temperature of ~ 16 K in its surrounding cloud (B. Ladjelate, priv. comm.), favouring the production of O2 in ices according to the scenario presented by Taquet et al. (2016).
2 Observations and data reduction
IRAS 16293, located at 141 pc, has a total luminosity of 21 L⊙ and a total envelope mass of 2 M⊙ (Jørgensen et al. 2005; Lombardi et al. 2008; Ortiz-Leon et al. 2017; Dzib et al. 2018). It consists of a binary system with two sources A and B separated by 5.′′1 or 720 AU (Looney et al. 2000; Chandler et al. 2005). Due to its bright molecular emission and relatively narrow transitions, IRAS 16293 has been a template for astrochemical studies (see Jørgensen et al. 2016, for a more detailed overview of the system). Source A, located towards the south-east of the system, has broader lines than source B, which could possibly be attributed to the different geometries of their disks. Transitions towards Source A present a velocity gradient consistent with the Keplerian rotation of an inclined disk-like structure whereas Source B is close to face-on (Pineda et al. 2012; Zapata et al. 2013). Several unbiased chemical surveys have been carried out towards IRAS 16293 using single-dish or interferometric facilities (Caux et al. 2011; Jørgensen et al. 2011) to obtain a chemical census of this source. A deep ALMA unbiased chemical survey of the entire Band 7 atmospheric window between 329.15 and 362.90 GHz has recently been performed in the framework of the Protostellar Interferometric Line Survey (PILS; Jørgensen et al. 2016). The unprecedented sensitivity and angular resolution offered by ALMA allows for strong constraints to be put on the chemical organic composition and the physical structure of the protostellar system (Jørgensen et al. 2016, 2018; Coutens et al. 2016, 2018; Lykke et al. 2017; Ligterink et al. 2017; Jacobsen et al. 2018; Persson et al. 2018; Drozdovskaya et al. 2018). The 16O18O 32 − 11 transition at 345.017 GHz lies in the ALMA PILS frequency range. However, this line is expected to be much weaker than the 21 − 01 transition at 233.946 GHz due to its lower Einstein coefficient (1.8 × 10⁻⁹ vs. 1.3 × 10⁻⁸ s−1). A simple model assuming local thermal equilibrium (LTE) and an excitation temperature Tex of 300 K suggests that the intensity of the 345.017 GHz transition is five times lower than that at 233.946 GHz, suggesting that it cannot provide deeper constraints on the O2 column density towards IRAS 16293.
IRAS 16293 was observed with the 12 m antenna array of ALMA during Cycle 4, under program 2016.1.01150.S (PI: Taquet), with the goal of searching for 16O18O at a similar angular resolution as the PILS data. The observations were carried out during four executions on 2016 November 10, 20, 22, and 26 in dual-polarization mode in Band 6. IRAS 16293 was observed with one pointing centred on αJ2000 = 16:32:22.72, δJ2000 = − 24 : 28 : 34.3 located between sources A and B. Between 39 and 40 antennas of the main array were used, with baselines ranging from 15.1 to 1062.5 m. The primary beam is 25.′′6 while the synthesized beam has been defined to 0.′′5 to match the beam size of the PILS data. The bandpass calibrators were J1527–2422 (execution 1) and J1517–2422 (executions 2–4), the phase calibrator was J1625–2527, and the flux calibrators were J1527–2422 (executions 1–3) and J1517–2422 (execution 4). Four spectral windows were observed each with a bandwidth of 468.500 MHz and a spectral resolution of 122 kHz or 0.156 km s−1 and covered 233.712−234.180, 234.918−235.385, 235.908−236.379, and 236.368−236.841 GHz. The data were calibrated with the CASA software (McMullin et al. 2007, version 4.7.3).
The continuum emission has been subtracted from the original datacube in order to image individual transitions. Due to the high sensitivity of the data, it is impossible to find spectral regions with line-free channels that can be used to derive the continuum emission. Instead, we follow the methodology defined in Jørgensen et al. (2016) to obtain the continuum emission maps that can be used to subtract it from the original datacubes. In short, the continuum is determined in two steps. First, a Gaussian function is used to fit the emission distribution towards each pixel of the datacube. A second Gaussian function is then fitted to the part of the distribution within F ±ΔF where F and ΔF are the centroid and the width of the first Gaussian, respectively. The centroid of the second Gaussian function is then considered as the continuum level for each pixel.
After the continuum subtraction, the four final spectral line datacubes have a root mean square (rms) sensitivity of 1.2−1.4 mJy beam−1 channel−1 or 0.47−0.55 mJy beam−1 km s−1. This provides the deepest ALMA dataset towards this source in this Band obtained so far.
Properties of the transitions targeted in this work.
3 Results
3.1 Overview of the Band 6 data
As discussed by Lykke et al. (2017), around source B, most molecular transitions reach their intensity maximum about 0.′′25 away from the continuum peak of IRAS 16293 B in the south-west direction (see also the images in Baryshev et al. 2015). However, most transitions towards this position are usually optically thick and absorption features are prominent. A “full-beam” offset position, located twice further away relative to the continuum peak in the same direction, gives a better balance between molecular emission intensities and absorption features. Figures A.1–A.4 show the spectra of the four spectral windows obtained towards the full-beam offset position located 0.′′5 away from the continuum peak of IRAS 16293 B in the south-west direction whose coordinates are αJ2000 = 16:32:22.58, δJ2000 = −24:28:32.8.
We detect a total of 671 transitions above the 5σ level, giving a line density of 358 transitions per GHz or one transition every 2.8 MHz. To identify the transitions, an LTE model is applied assuming a systemic velocity Vlsr = 2.7 km s−1, a line width FWHM = 1 km s−1, and a Gaussian source distribution with a size of 0.′′5, resulting in a beam filling factor of 0.5. We used the column densities and excitation temperatures derived from the PILS survey (Jørgensen et al. 2016, 2018; Coutens et al. 2016; Lykke et al. 2017; Ligterink et al. 2017; Fayolle et al. 2017; Persson et al. 2018; Drozdovskaya et al. 2018). The model computes the intensity following the methodology summarised in Goldsmith et al. (1999). In particular, the overall opacity of each transition is computed but does not affect the profile of the transition that is assumed to remain Gaussian. A total number of 253 spectroscopic entries mostly using the CDMS (Müller et al. 2005; Endres et al. 2016) and JPL (Pickett et al. 1998) catalogues including rare isotopologues and vibrationally excited states have been used. The LTE model overestimates the intensity of most common species since the optical depths still remain high even at a distance of 0.′′5 away from the continuum peak. In spite of the high number of species included in the model, ~ 70% of the ~ 670 transitions remain unidentified at a 5σ level. Most identified transitions are attributed to oxygen-bearing complex organic molecules including their main and rare isotopologues, such as methyl formate CH3OCHO, acetic acid CH3COOH, acetaldehyde CH3CHO, ethylene glycol (CH2OH)2, ethanol C2 H5OH, or methanol CH3OH. This serves as a warning that care must be taken with identifications based on single lines. A significant part of unidentified lines could be due to additional vibrationally excited states and isotopologues of COMs that are not yet characterised by spectroscopists. The properties of the targeted 16O18O, HO2, and H2 O2 transitions are listed in Table 1.
3.2 Analysis of the 16O18O transition
Figure 1 shows the spectra around the 16O18O transition at 233.946 GHz towards the continuum peak of IRAS 16293 B, with a source velocity VLSR = 2.7 km s−1, as well as the half-beam and full-beam offset positions in the north-east and south-west directions. It can be seen that the 16O18O transition is surrounded by two brighter transitions peaking at 1.9 km s−1 and 3.8 km s−1. Line identification analysis using the CDMS and JPL databases only revealed one possibility, the hydroxymethyl CH2OH radical whose laboratory millimetre spectrum has recently been obtained by Bermudez et al. (2017). In spite of the high uncertainty of 4 MHz for thefrequency of these two transitions, this doublet is the best match with a doublet splitting frequency of 1.56 MHz (=2.0 km s−1), and with similar upper level energies of 190 K and Einstein coefficients of 3.7 × 10⁻⁵ s−1. We fitted the doublet around 233.946 GHz by varying the CH2OH column density and assuming an excitation temperature Tex = 125 K, following the excitation temperature found for complex organic molecules by Jørgensen et al. (2016). The doublet towards the western half-beam position, whose coordinates are (−0.′′2; −0.′′1) relative to IRAS 16293 B, is best fitted with N(CH2OH) = 3 × 1016 cm−2 = 0.15% relative to CH3OH, assuming N(CH3OH) = 2 × 1019 cm−2 (Jørgensen et al. 2016). Using the derived column density and an excitation temperature of 125 K, CH2OH should have several detectable transitions in the PILS data at Band 7 that are free from contamination. However, the four brightest transitions at ~ 362 GHz with Eup of 223 K are expected to have intensity peaks of ~0.1 Jy beam−1 but are not detected with a sensitivity of 5 mJy beam km s−1, a factor of 20 lower, negating this identification of CH2OH.
As shown by Pagani et al. (2017) who searched for 16O18O towards Orion KL with ALMA, the transition at ~4 km s−1 shown in Fig. 1 could be attributed to two transitions at 233.944899 and 233.945119 GHz (or 3.9 and 4.2 km s−1) from the vibrationally excited state v13 + v21 = 1 of C2 H5CN.
The two surrounding transitions have first been fitted by Gaussian functions. Faint excess emission with respect to the Gaussian best-fits can be seen between the two brighter surrounding transitions at ~ 3.0 km s−1, in particular for the continuum peak and the two western positions, as shown in the residual spectra in Fig. 1. However, line profiles around IRAS 16293 B do not necessarily follow symmetric Gaussian profiles (see Zapata et al. 2013) and the weak intensity excess seen at ~3.0 km s−1 could be due to the complex line profiles of the two surrounding transitions. We therefore used the profile of other nearby transitions as references to fit the profiles of the two contaminating transitions towards each pixel of the map around IRAS 16293 B. We looked for nearby optically thin transitions with similar intensities and line widths and free from contamination from other lines. The transition chosen as reference is the CH3NCO transition at 234.08809 GHz but several other transitions with similar profiles could have been used. For each pixel of the data cube, we fitted the two transitions with the profile of the CH3NCO transition by varying the intensity maximum and the intensity peak velocity when one of the transitions is detected above the 2σ level. The spectra of the residual emission are shown in Fig. 1 while the integrated emission maps before and after the subtraction of the best-fits are shown in Fig. 2 for three velocity ranges: 1.3−2.8, 2.8−3.2, and 3.2−4.6 km s−1. The residual spectra still show a weak intensity emission around 2.8−3.2 km s−1 towards the continuum peak and the two western positions both using the Gaussian and the “observed” line profiles. The intensity peaks are about 4− 6 mJy beam−1, therefore just above the 3σ limit with a rms noise of ~ 1.3 mJy beam−1 channel−1. The weak emission can also be seen in the integrated emission maps in Fig. 2. Although no residual emission is detected at a 3σ level for the surrounding transition velocity ranges, the residual map at 2.8−3.2 km s−1 shows some emission above the 3σ level towards IRAS 16293 B.
Given the low signal-to-noise ratio (S/N) of the residual transition and its velocity shift with respect to the source velocity of 2.7 km s−1, we derive the O2 column density by considering a non-detection and a tentative detection. An upper limit to the O2 column density is first obtained by deriving the 3σ intensity upper limits  of the transition at 233.946 GHz of the residual spectrum, where σ is the rms noise of the spectrum, FWHM is the expected full width at half maximum line width of the transition, assumed to be 1.0 km s−1, and δv is the velocity resolution (=0.156 km s−1). We assumed LTE and we varied the excitation temperature Tex between 125 K and 300 K, the excitation temperatures usually derived for other species near IRAS 16293 B (see Lykke et al. 2017; Jørgensen et al. 2018). We obtain an upper limit in N(16O18O) of (1.5−3.2) × 1017 cm−2, implying an upper limit in the O2 column density of (4.2−9.0) × 1019 cm−2, assuming a 16O18O/O2 abundance ratio of 280 taking into account that 18O can be in two positions in the molecule (Wilson & Rood 1994).
Assuming now that the residual transition is real and is due to the presence of 16O18O, we derive its integrated intensity towards the western half-beam position peak through a Gaussian fit. We thus obtain a 16O18O column density of (3.5−7.5) × 1017 cm−2 for Tex= 125−300 K, giving N(O2) = (9.9−21) × 1019 cm−2.
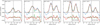 |
Fig. 1 Observed spectra (in blue) around the 16O18O transition at 233.946098 GHz towards five positions in IRAS 16293 B depicted in the maps in Fig. 2. Red and green lines show the best-fit curves to the data assuming a Gaussian profile and the profile from the CH3 NCO transition at 234.08809 GHz, respectively. Residual spectra of the best-fit Gaussian and reference transition profiles are shown below the observed spectra in red and green, respectively. Positions in arcseconds relative to the continuum peak position of IRAS 16293 B are shown at the top left of each panel. The vertical and horizontal black dashed lines depict the source velocity at 2.7 km s−1 and the baseline, respectively. |
3.3 Analysis of the HO2 and H2 O2 transitions
Only one detectable H2 O2 transition lies in our ALMA Band 6 dataset at 235.955 GHz. Unfortunately, the H2 O2 transition is dominated by a transition from the ethylene oxide c-C2H4O species already detected in the Band 7 PILS data by Lykke et al. (2017). Figure 3 compares the spectrum observed towards the western full-beam offset position around the H2 O2 frequency with the synthetic spectrum assuming the column densities and excitation temperatures derived by Lykke et al. (2017). The LTE model gives a reasonable fit to the observed transition suggesting that c-C2H4O is likely responsible for most, if not all, of the transition intensity. It is therefore impossible to conclude anything on the presence of H2 O2 in IRAS 16293 B because no detectable H2 O2 transitions lie in the PILS Band 7 data.
The spectral windows have also been chosen to observe five bright transitions from HO2 whose frequencies and properties are listed in Table 2. The transition at 235.170 GHz is contaminated by an ethyl glycol transition and the transition at 236.284 GHz is contaminated by a methyl formate transition. The LTE model presented in Sect. 3.1 gives a good fit to these transitions and does not allow us to use them to confirm the presence of HO2. None of the remaining transitions are detected. The transition at 236.280 GHz would have given the strongest constraint on the upper limit in HO2 column density because of its high Einstein coefficient (Ai,j = 7.7 × 10⁻⁵ s−1). Figure 3 shows the spectrum around the transition at 236.280 GHz towards the western full-beam offset position. It can be seen that a transition peaking at 2.4 km s−1 is partially contaminating the targeted HO2 transition. We have not been able to identify the species responsible for this transition. Ethyl formate, trans-C2H5OCHO, was thoughtto be a plausible species since the frequency of two bright transitions match that of the observed line. However, this species has been ruled out because brighter transitions are not detected in our ALMA dataset. In order to derive the upper limit in the HO2 column density, we vary the column density that reproduces best the wing between 3.0 and 3.6 km s−1 of the observed spectrum for excitation temperatures between 125 K and 300 K assuming LTE emission. We obtained upper limits of N(HO2) ≤ 1.1 × 10¹⁴ and ≤ 2.8 × 1014 cm−2 for Tex= 125 and 300 K, respectively. We confirmed a posteriori that the other HO2 transitions are not detected at the 3σ limit with the derived column densities.
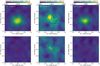 |
Fig. 2 Top panels: integrated intensity maps around the 16O18O transition at 233.946098 GHz for velocities of 1.3−2.8 (left panel), 2.8−3.2 (middle panel), and 3.2−4.6 (right panel)km s−1. Bottom panels: residual maps of the integrated intensity emission after subtraction of the fit performed with the line profile of the reference transition. Contours are in steps of 3σ, with σ of 1.07, 0.54, and 1.08 mJy beam−1 km s−1, respectively.The red star symbols depicts the position of the IRAS16293 B continuum peak while red crosses show the positions of the half-beam and full-beam offset positions mentioned in the text. |
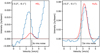 |
Fig. 3 Observed spectra (in blue) around the HO2 transition at 236.280920 GHz (left panel) and around the H2O2 transition at 235.955943 GHz (right panel), respectively, towards the western half beam position. The red line in the left and right panels shows the modelled spectrum at LTE obtained with a HO2 column density of 1.1 × 1014 cm−2 and Tex = 125 K and a c-C2H4O column density of 6.1 × 1015 cm−2 and Tex = 125 K, respectively (see text). Positions in arcsec relative to the continuum peak position of IRAS 16293 B are shown at the top left of each panel. The vertical and horizontal black dashed lines depict the source velocity at 2.7 km s−1 and the baseline, respectively. |
Column densities and abundances relative to CH3OH of O2, HO2, and H2 O2.
4 Discussion and conclusions
The 16O18O transition at 233.946 GHz is contaminated by two brighter transitions at ± 1 km s−1 relative to the expected targeted transition frequency. After subtraction of these two transitions, residual emission remains at a 3σ level but with a velocity offset of 0.3−0.5 km s−1 with respect to the source velocity. We therefore assume two cases, a tentative detection of the 16O18O transition and a more realistic non-detection. In the follo- wing, we consider the non-detection case to compare the abundance of O2 with water and methanol. The H2O abundance towards IRAS 16293 B is still unknown because only one transition of H O has been detected in absorption by Persson et al. (2013) using ALMA. We therefore decide to use first methanol as a reference species. The CH3OH column density N(CH3OH) has been accurately derived using a large number of transitions from its optically thin CH
 OH isotopologue by Jørgensen et al. (2016, 2018), giving N(CH3OH) = 2 × 10¹⁹ and 1 × 1019 cm−2 towards the western half-beam and full-beam offset positions of IRAS 16293 B, respectively. For the case that the O2 transition is a non-detection, we therefore derive [O2]/[CH3OH] ≤ 2.1−4.5. Water ice has a typical abundance of 1 × 10⁻⁴ relative to H2 in molecularclouds (Tielens et al. 1991; Pontoppidan et al. 2004; Boogert et al. 2015) and is expected to fully sublimate in the warm gas around protostars once the temperature exceeds the water sublimation temperature of ~ 100 K. Jørgensen et al. (2016) derived a lower limit for the H2 column density N(H2) > 1.2 × 1025 cm−2, resulting in a lower limit in the H2O column density N(H2O) > 1.2 × 1021 cm−2. This results in estimates of [CH3OH]/[H2O] < 1.6% and [O2]/[H2O] < 3.5%.
Gaseous O2 detected in the hot core of IRAS 16293 B is expected to result mostly from the sublimation of solid O2 locked into ices (see Yıldiz et al. 2013, for instance). Gas-phase hot-core chemistry that could destroy O2 through UVphoto-dissociation or neutral-neutral reactions after its evaporation from the interstellar ices is likely inefficient. Photo-dissociation is probably not at work here due to the optically thick protostellar envelope present around the young Class 0 protostar that shields any strong UV radiation field. In addition, the gas-phase temperature around IRAS 16293 B of 100−300 K is likely too low to trigger the reactivity of the reaction between O2 and H because of the large activation barrier of 8380 K. The O2 abundance inferred from our ALMA observations should therefore reflect the abundance of icy O2 in the prestellar core at the origin of the IRAS 16293 protostellar system.
The O2 abundance lower than 3.5% relative to water is consistent with the upper limits in the solid O2 abundance of ≤15 and ≤39% relative to H2O found towards the low-mass protostar R CrA IRS2 and the massive protostar NGC 7538 IRS9, respectively (Vandenbussche et al. 1999; Boogert et al. 2015). The upper limits are also consistent with the predictions by Taquet et al. (2016) who modelled the formation and survival of solid O2 for a large range of dark cloud conditions and found values lower than a few percent for a large range of model parameters. The extended core of IRAS 16293 has a dust temperature of 16 K based on observations of the Ophiuchus cloud with the SPIRE and PACS instruments of the Herschel Space Observatory as part of the Gould Belt Survey key program (André et al. 2010; B. Ladjelate, priv. comm.). According to the Taquet et al. (2016) model predictions, assuming a temperature of 16 K, the prestellar core that formed IRAS 16293 could have spent most of its lifetime at a density lower than 105 cm−3 and/or a cosmic ray ionisation rate higher than 10−17 s−1, allowing ice formation with an efficient hydrogenation process that favours the destruction of O2 into H2 O2 and H2O.
As the O2 abundance derived around IRAS 16293 B likely reflects the O2 abundance in interstellar ices before their evaporation, it can be compared with the abundance measured in comets to follow the formation and survival of O2 from dark clouds to planetary systems. CH3OH has also been detected in comet 67P at the same mass 32 as O2 by the ROSINA mass spectrometer onboard Rosetta with an abundance of 0.31−0.55% relative to H2 O (Le Roy et al. 2015), implying a [O2]/[CH3OH] abundance ratio of 5.3−15. Under the safer assumption that O2 is not detected towards IRAS 1693 B, the derived upper limit [O2]/[CH3OH] ≤ 2.1−4.5 measured inIRAS 16293 B is slightly lower than the abundance measured in 67P. However, the CH3OH abundance is about ten times lower in 67P than the median abundance found in interstellar ices towards a sample of low-mass protostars (CH3OH/H2O ~ 7%; Bottinelli et al. 2010; Öberg et al. 2011). The low CH3OH abundance measured in comet 67P could explain the differences in [O2]/[CH3OH] between IRAS 16293 and 67P. Using water as a reference species, the [O2]/[H2O] ≤ 3.5% in IRAS 16293 B falls within the abundance range of 2.95−4.65% observed in comet 67P by ROSINA. With a temperature of 16 K, the precursor dark cloud of IRAS 16293 is slightly colder than the temperature of 20−25 K required to enhance the O2 formation in interstellar ices within dark clouds (Taquet et al. 2016). Further interferometric observations of 16O18O towards other bright nearby low-mass protostars located in warmer environments than the cloud surrounding IRAS 16293 could result in an unambiguous detection of molecular oxygen O2 around young protostars. Such a study would confirm the primordial origin of cometary O2 in our solar system.
Acknowledgements
We thank the referee, Gary Melnick, for his useful comments, which helped to improve the manuscript. This paper makes use of the following ALMA data: ADS/JAO.ALMA#2016.1.01150.S. ALMA is a partnership of ESO (representing its member states), NSF (USA), and NINS (Japan), together with NRC (Canada) and NSC and ASIAA (Taiwan), in cooperation with the Republic of Chile. The Joint ALMA Observatory is operated by ESO, AUI/NRAO, and NAOJ. V.T. acknowledges the financial support from the European Union’s Horizon 2020 research and innovation programme under the Marie Sklodowska-Curie grant agreement No. 664931. Astrochemistry in Leiden is supported by the European Union A-ERC grant 291141 CHEMPLAN, by the Netherlands Research School for Astronomy (NOVA) and by a Royal Netherlands Academy of Arts and Sciences (KNAW) professor prize. J.K.J. acknowledges support from the European Research Council (ERC) under the European Union’s Horizon 2020 research and innovation programme (grant agreement No. 646908) through ERC Consolidator Grant “S4F” A.C. postdoctoral grant is funded by the ERC Starting Grant 3DICE (grant agreement No. 336474). C.W. acknowledges financial support from the University of Leeds.
Appendix A: Spectra of the full spectral windows
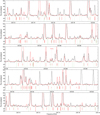 |
Fig. A.1 Spectrum (black) of the first spectral window between 233.712 and 234.180 GHz obtained towards the full-beam offset position located 0.′′5 away from the continuum peak of IRAS 16293 B in the south-west direction. Synthetic spectrum of the LTE model is shown in red (see text for more details). Green dotted lines refer to the position of transitions of unidentified species detected above 5σ. |
References
- Altwegg, K., Balsiger, H., Bar-Nun, A., et al. 2015, Science, 347, 27 [NASA ADS] [CrossRef] [Google Scholar]
- André, P., Men’shchikov, A., Bontemps, S., Könyves, V., et al. 2010, A&A, 518, L102 [NASA ADS] [CrossRef] [EDP Sciences] [Google Scholar]
- Baryshev, A. M., Hesper, R., Mena, F. P., Klapwijk, T. M., et al. 2015, A&A, 577, A129 [NASA ADS] [CrossRef] [EDP Sciences] [Google Scholar]
- Bermudez, C., Bailleux, S., & Cernicharo, J. 2017, A&A, 598, A9 [NASA ADS] [CrossRef] [EDP Sciences] [Google Scholar]
- Bieler, A., Altwegg, K., Balsinger, H., et al. 2015, Nature, 526, 678 [Google Scholar]
- Boogert, A., Gerakines, P., & Whittet, D. 2015, ARA&A, 53, 541 [Google Scholar]
- Bottinelli, S., Boogert, A. C. A., Bouwman, J., Beckwith, M., et al. 2010, ApJ, 718, 1100 [NASA ADS] [CrossRef] [Google Scholar]
- Caux, E., Kahane, C., Castets, A., et al. 2011, A&A, 532, A23 [NASA ADS] [CrossRef] [EDP Sciences] [Google Scholar]
- Chance, K. V., Park, K., Evenson, K. M., Zink, L. R., & Stroh, F. 1995, J. Mol. Spectrosc., 172, 407 [NASA ADS] [CrossRef] [Google Scholar]
- Chandler, C. J., Brogan, C. L., Shirley, Y. L., & Loinard, L. 2005, ApJ, 632, 371 [NASA ADS] [CrossRef] [Google Scholar]
- Chen, J-H., Goldsmith, P. F., Viti, S., et al. 2014, ApJ, 793, 111 [NASA ADS] [CrossRef] [Google Scholar]
- Coutens, A., Jørgensen, J. K., van der Wiel, M. H. D., et al. 2016, A&A, 590, L6 [Google Scholar]
- Coutens, A., Willis, E. R., Garrod, R. T., Müller, H. S. P., et al. 2018, A&A, 612, A107 [NASA ADS] [CrossRef] [EDP Sciences] [Google Scholar]
- Drouin, B. J., Yu, S., Miller, C. E., Müller, H. S. P., Lewen, F., Brünken, S., & H. Habara, 2010, J. Quant. Spectr. Rad. Transf., 111, 1167 [NASA ADS] [CrossRef] [Google Scholar]
- Drozdovskaya, M. N., van Dishoeck, E. F., Jørgensen, J. K., et al. 2018, MNRAS, 476, 4949 [NASA ADS] [CrossRef] [Google Scholar]
- Dulieu, F., Minissale, M., & Bockelée-Morvan, D. 2017, A&A, 597, A56 [NASA ADS] [CrossRef] [EDP Sciences] [Google Scholar]
- Dzib, S. A., Ortiz-León, G. N., Hernández-Gómez, A., Loinard, L., et al. 2018, A&A, 614, A20 [NASA ADS] [CrossRef] [EDP Sciences] [Google Scholar]
- Endres, C. P., Schlemmer, S., Schilke, P., Stutzki, J., & Müller, H. S. P. 2016, J. Mol. Spectr., 327, 95 [NASA ADS] [CrossRef] [Google Scholar]
- Fayolle, E. C., Öberg, K. I., Jørgensen, J. K., Altwegg, K., et al. 2017, Nat. Astron., 1, 703 [NASA ADS] [CrossRef] [Google Scholar]
- Goldsmith, P. F., Snell, R. L., Erickson, N. R., et al. 1985, ApJ, 289, 613 [NASA ADS] [CrossRef] [PubMed] [Google Scholar]
- Goldsmith, P. F., Langer, W. D., & Velusamy, T. 1999, ApJ, 519, L173 [NASA ADS] [CrossRef] [Google Scholar]
- Goldsmith, P. F., Liseau, R., Bell, T. A., et al. 2011, ApJ, 737, 96 [Google Scholar]
- Hirota, T., Bushimata, T., Choi, Y. K., Honma, M., et al. 2008, PASJ, 60, 37 [NASA ADS] [CrossRef] [Google Scholar]
- Jacobsen, S. K, Jørgensen, J. K., van der Wiel, M. H. D., et al. 2018, A&A, 612, A72 [NASA ADS] [CrossRef] [EDP Sciences] [Google Scholar]
- Jørgensen, J. K., Lahuis, F., Schöier, F. L., et al. 2005, ApJ, 631, L77 [NASA ADS] [CrossRef] [Google Scholar]
- Jørgensen, J. K., Bourke, T. L., Nguyen Luong, Q., & Takakuwa, S. 2011, A&A, 534, A100 [NASA ADS] [CrossRef] [EDP Sciences] [Google Scholar]
- Jørgensen, J. K., van der Wiel, M. H. D., Coutens, A., Lykke, J. M., et al. 2016, A&A, 595, A117 [NASA ADS] [CrossRef] [EDP Sciences] [Google Scholar]
- Jørgensen, J. K., Müller, H. S. P., Calcutt, H., et al. 2018, A&A, in press, DOI: 10.1051/0004-6361/201731667 [Google Scholar]
- Karska, A., Herczeg, G. J., van Dishoeck, E. F., Wampfler, S. F., Kristensen, L. E., et al. 2013, A&A, 552, A141 [NASA ADS] [CrossRef] [EDP Sciences] [Google Scholar]
- Keeney, B. A., Stern, S. A., A’Hearn, M. F., Bertaux, J.-L., et al. 2017, MNRAS, 469, S158 [CrossRef] [Google Scholar]
- Larsson, B., Liseau, L., Pagani, L., et al. 2007, A&A, 466, 999 [Google Scholar]
- Le Roy, L., Altwegg, K., Balsiger, H., Berthelier, J.-J., Bieler, A., et al. 2015, A&A, 583, A1 [Google Scholar]
- Ligterink, N. F. W., Coutens, A., Kofman, V., et al. 2017, MNRAS, 469, 2219 [NASA ADS] [CrossRef] [Google Scholar]
- Liseau, R., Larsson, B., Bergman, P., et al. 2010, A&A, 510, A98 [NASA ADS] [CrossRef] [EDP Sciences] [Google Scholar]
- Liseau, R., Goldsmith, P. F., Larsson, B., et al. 2012, A&A, 541, A73 [NASA ADS] [CrossRef] [EDP Sciences] [Google Scholar]
- Liszt, H. S. & Vanden Bout P. A. 1985, ApJ, 291, 178 [NASA ADS] [CrossRef] [Google Scholar]
- Lombardi, M., Lada, C. J., & Alves, J. 2008, A&A, 480, 785 [NASA ADS] [CrossRef] [EDP Sciences] [Google Scholar]
- Looney, L. W., Mundy, L. G., & Welch, W. J. 2000, ApJ, 529, 477 [NASA ADS] [CrossRef] [Google Scholar]
- Lykke, J. M., Coutens, A., Jørgensen, J. K., et al. 2017, A&A, 597, A53 [NASA ADS] [CrossRef] [EDP Sciences] [Google Scholar]
- McMullin, J. P., Waters, B., Schiebel, D., Young, W., & Golap, K. 2007, Astronomical Data Analysis Software and Systems XVI, eds. R. A. Shaw, F. Hill, & D. J. Bell (San Francisco: ASP), ASP Conf. Ser., 376, 127 [NASA ADS] [Google Scholar]
- Mousis, O., Ronnet, T., Brugger, B., et al. 2016, ApJ, 823, L41 [NASA ADS] [CrossRef] [Google Scholar]
- Müller, H. S. P., Schlöder, F., Stutzki, J., & Winnewisser, G. 2005, J. Mol. Struct., 742, 215 [NASA ADS] [CrossRef] [Google Scholar]
- Öberg, K. I., Boogert, A. C. A., Pontopiddan, K. M., et al. 2011, ApJ, 740, 109 [NASA ADS] [CrossRef] [Google Scholar]
- Ortiz-León, G. N., Loinard, L., Kounkel, M. A., Dzib, S. A., et al. 2017, ApJ, 834, 141 [NASA ADS] [CrossRef] [Google Scholar]
- Pagani, L., Favre, C., Goldsmith, P. F., et al. 2017, A&A, 604, A32 [NASA ADS] [CrossRef] [EDP Sciences] [Google Scholar]
- Persson, M. V., Jørgensen, J. K., & van Dishoeck, E. F. 2013, A&A, 543, L3 [NASA ADS] [CrossRef] [EDP Sciences] [Google Scholar]
- Persson, M. V., Jørgensen, J. K., Müller, H. S. P., Coutens, A., et al. 2018, A&A, 610, A54 [NASA ADS] [CrossRef] [EDP Sciences] [Google Scholar]
- Petkie, D. T., Goyette, T. M., Holton, J. J., De Lucia F. C., & Helminger, P. 1995, J. Mol. Spectrosc., 171, 145 [Google Scholar]
- Pickett, H. M., Poynter, R. L., Cohen, E. A., Delitsky, M. L., et al. 1998, J. Quant. Spectr. Rad. Transf., 60, 883 [NASA ADS] [CrossRef] [Google Scholar]
- Pineda, J. E., Maury, A. J., Fuller, G. A., et al. 2012, A&A, 544, L7 [NASA ADS] [CrossRef] [EDP Sciences] [Google Scholar]
- Pontoppidan, K. M., van Dishoeck, E. F., & Dartois, E. 2004, A&A, 426, 925 [NASA ADS] [CrossRef] [EDP Sciences] [Google Scholar]
- Rubin, M., Altwegg, K., Balsiger, H., et al. 2015a, Science, 348, 232 [NASA ADS] [CrossRef] [Google Scholar]
- Rubin, M., Altwegg, K., van Dishoeck, E. F., & Schwehm, G. 2015b, ApJ, 815, L11 [NASA ADS] [CrossRef] [Google Scholar]
- Taquet, V., Furuya, K., Walsh, C., & van Dishoeck, E. F. 2016, MNRAS, 462, S99 [NASA ADS] [CrossRef] [Google Scholar]
- Tielens, A. G. G. M., Tokunaga, A. T., Geballe, T. R., & Baas, F. 1991, ApJ, 381, 181 [NASA ADS] [CrossRef] [PubMed] [Google Scholar]
- Vandenbussche, B., Ehrenfreund, P., Boogert, A. C. A., van Dishoeck, E. F., et al. 1999, A&A, 346, L57 [NASA ADS] [Google Scholar]
- Wilson, T. L., & Rood, R. 1994, ARA&A, 32, 191 [NASA ADS] [CrossRef] [Google Scholar]
- Yildiz, U. A., Acharyya, K., Goldsmith, P. F., et al. 2013, A&A, 558, A58 [NASA ADS] [CrossRef] [EDP Sciences] [Google Scholar]
- Zapata, L. A., Loinard, L., Rodríguez, L. F., et al. 2013, ApJ, 764, L14 [NASA ADS] [CrossRef] [Google Scholar]
- Zheng, W., Jewitt, D., & Kaiser, R. I. 2006, ApJ, 639, 534 [NASA ADS] [CrossRef] [Google Scholar]
All Tables
All Figures
|
Fig. 1 Observed spectra (in blue) around the 16O18O transition at 233.946098 GHz towards five positions in IRAS 16293 B depicted in the maps in Fig. 2. Red and green lines show the best-fit curves to the data assuming a Gaussian profile and the profile from the CH3 NCO transition at 234.08809 GHz, respectively. Residual spectra of the best-fit Gaussian and reference transition profiles are shown below the observed spectra in red and green, respectively. Positions in arcseconds relative to the continuum peak position of IRAS 16293 B are shown at the top left of each panel. The vertical and horizontal black dashed lines depict the source velocity at 2.7 km s−1 and the baseline, respectively. |
| In the text | |
|
Fig. 2 Top panels: integrated intensity maps around the 16O18O transition at 233.946098 GHz for velocities of 1.3−2.8 (left panel), 2.8−3.2 (middle panel), and 3.2−4.6 (right panel)km s−1. Bottom panels: residual maps of the integrated intensity emission after subtraction of the fit performed with the line profile of the reference transition. Contours are in steps of 3σ, with σ of 1.07, 0.54, and 1.08 mJy beam−1 km s−1, respectively.The red star symbols depicts the position of the IRAS16293 B continuum peak while red crosses show the positions of the half-beam and full-beam offset positions mentioned in the text. |
| In the text | |
|
Fig. 3 Observed spectra (in blue) around the HO2 transition at 236.280920 GHz (left panel) and around the H2O2 transition at 235.955943 GHz (right panel), respectively, towards the western half beam position. The red line in the left and right panels shows the modelled spectrum at LTE obtained with a HO2 column density of 1.1 × 1014 cm−2 and Tex = 125 K and a c-C2H4O column density of 6.1 × 1015 cm−2 and Tex = 125 K, respectively (see text). Positions in arcsec relative to the continuum peak position of IRAS 16293 B are shown at the top left of each panel. The vertical and horizontal black dashed lines depict the source velocity at 2.7 km s−1 and the baseline, respectively. |
| In the text | |
|
Fig. A.1 Spectrum (black) of the first spectral window between 233.712 and 234.180 GHz obtained towards the full-beam offset position located 0.′′5 away from the continuum peak of IRAS 16293 B in the south-west direction. Synthetic spectrum of the LTE model is shown in red (see text for more details). Green dotted lines refer to the position of transitions of unidentified species detected above 5σ. |
| In the text | |
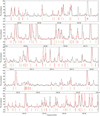 |
Fig. A.2 As in Fig. A.1 but for the spectral window between 234.918 and 235.385 GHz. |
| In the text | |
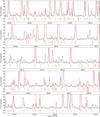 |
Fig. A.3 As in Fig. A.1 but for the spectral window between 235.908 and 236.379 GHz. |
| In the text | |
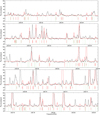 |
Fig. A.4 As in Fig. A.1 but for the spectral window between 236.379 and 236.841 GHz. |
| In the text | |
Current usage metrics show cumulative count of Article Views (full-text article views including HTML views, PDF and ePub downloads, according to the available data) and Abstracts Views on Vision4Press platform.
Data correspond to usage on the plateform after 2015. The current usage metrics is available 48-96 hours after online publication and is updated daily on week days.
Initial download of the metrics may take a while.