Fig. 1
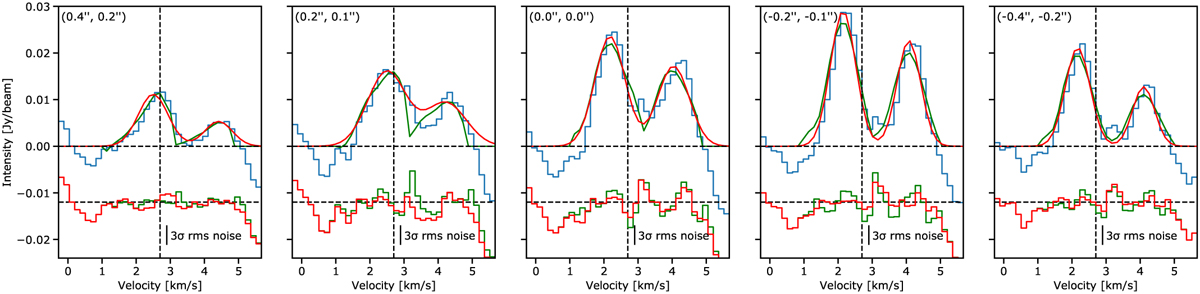
Observed spectra (in blue) around the 16O18O transition at 233.946098 GHz towards five positions in IRAS 16293 B depicted in the maps in Fig. 2. Red and green lines show the best-fit curves to the data assuming a Gaussian profile and the profile from the CH3 NCO transition at 234.08809 GHz, respectively. Residual spectra of the best-fit Gaussian and reference transition profiles are shown below the observed spectra in red and green, respectively. Positions in arcseconds relative to the continuum peak position of IRAS 16293 B are shown at the top left of each panel. The vertical and horizontal black dashed lines depict the source velocity at 2.7 km s−1 and the baseline, respectively.
Current usage metrics show cumulative count of Article Views (full-text article views including HTML views, PDF and ePub downloads, according to the available data) and Abstracts Views on Vision4Press platform.
Data correspond to usage on the plateform after 2015. The current usage metrics is available 48-96 hours after online publication and is updated daily on week days.
Initial download of the metrics may take a while.