Fig. 3
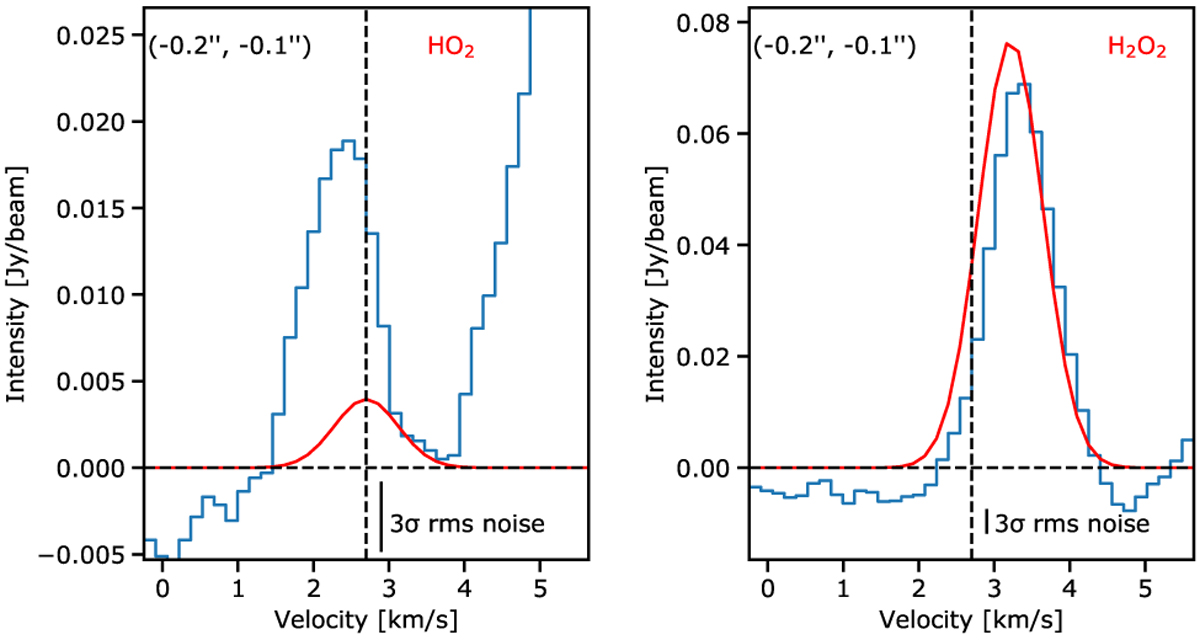
Observed spectra (in blue) around the HO2 transition at 236.280920 GHz (left panel) and around the H2O2 transition at 235.955943 GHz (right panel), respectively, towards the western half beam position. The red line in the left and right panels shows the modelled spectrum at LTE obtained with a HO2 column density of 1.1 × 1014 cm−2 and Tex = 125 K and a c-C2H4O column density of 6.1 × 1015 cm−2 and Tex = 125 K, respectively (see text). Positions in arcsec relative to the continuum peak position of IRAS 16293 B are shown at the top left of each panel. The vertical and horizontal black dashed lines depict the source velocity at 2.7 km s−1 and the baseline, respectively.
Current usage metrics show cumulative count of Article Views (full-text article views including HTML views, PDF and ePub downloads, according to the available data) and Abstracts Views on Vision4Press platform.
Data correspond to usage on the plateform after 2015. The current usage metrics is available 48-96 hours after online publication and is updated daily on week days.
Initial download of the metrics may take a while.