Fig. 7
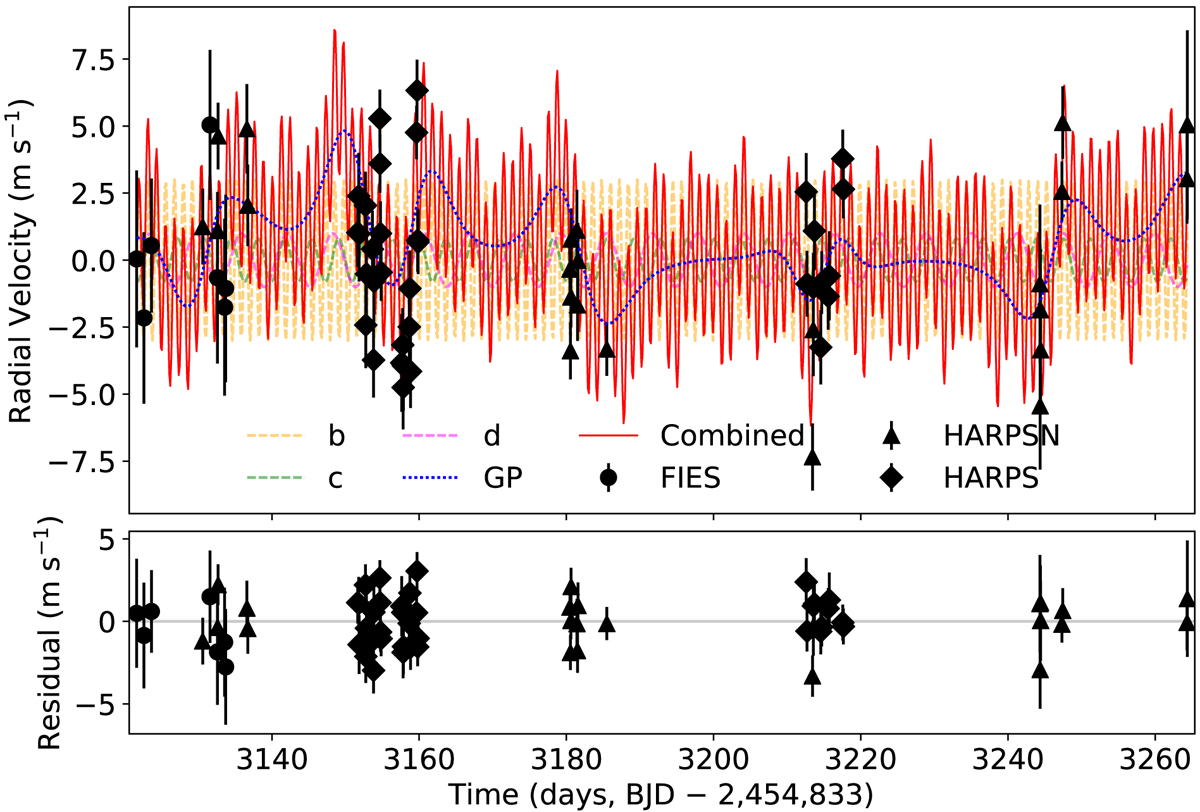
Measured radial velocity variation of GJ 9827 from FIES (circles) and HARPS (diamonds) and HARPS-N (triangles). The red solid line is the best-fit model including the signal of the planets and the Gaussian Process model of the correlated stellar noise. The colored dashed line shows the signal of the planets. The blue dotted line shows the Gaussian Process model of correlated stellar noise.
Current usage metrics show cumulative count of Article Views (full-text article views including HTML views, PDF and ePub downloads, according to the available data) and Abstracts Views on Vision4Press platform.
Data correspond to usage on the plateform after 2015. The current usage metrics is available 48-96 hours after online publication and is updated daily on week days.
Initial download of the metrics may take a while.