Fig. 5
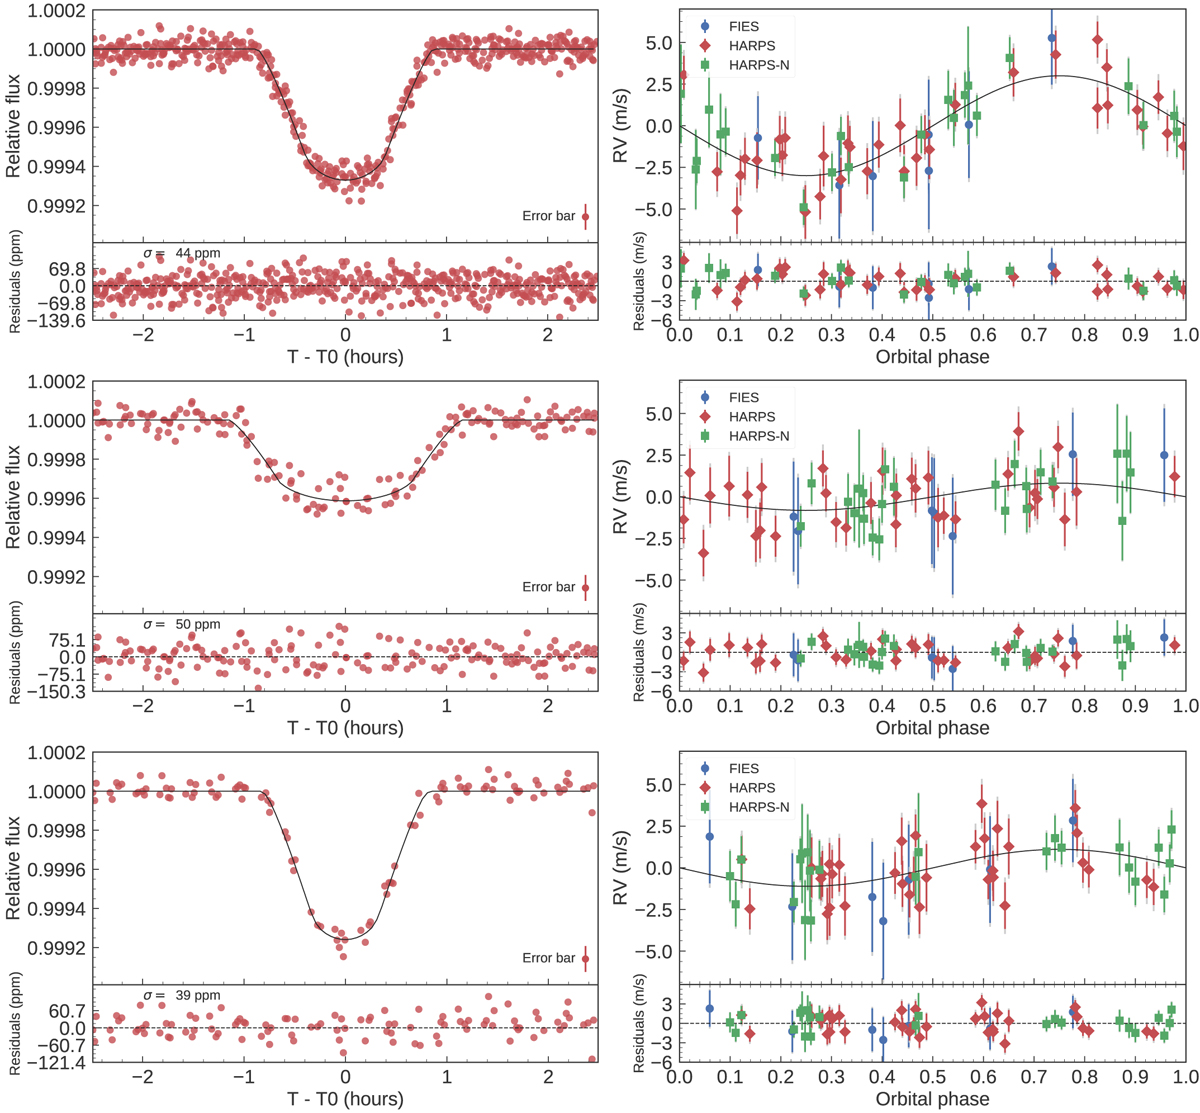
From top to bottom and left to right: transit fit and phase-folded RV curve of GJ 9827 b, GJ 9827 c, GJ 9827 d after removing the activity signal from the star and the signals from the other planets. The gray error bars account for additional instrumental noise and/or imperfect treatment of the various sources of RV variations.
Current usage metrics show cumulative count of Article Views (full-text article views including HTML views, PDF and ePub downloads, according to the available data) and Abstracts Views on Vision4Press platform.
Data correspond to usage on the plateform after 2015. The current usage metrics is available 48-96 hours after online publication and is updated daily on week days.
Initial download of the metrics may take a while.