Free Access
Fig. 2
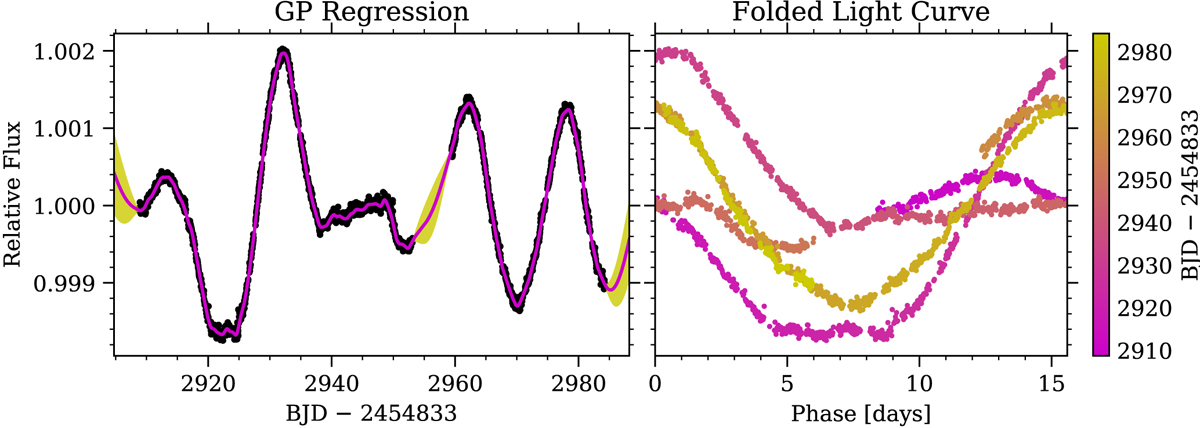
Left panel: Gaussian process regression model applied to the K2 light curve. The black points are the K2 light curve, and the purple curve and shaded band are the GP model predictive mean and 1-sigma uncertainty. Right panel: K2 light curve folded to the Prot ∕2 stellar rotational period.
Current usage metrics show cumulative count of Article Views (full-text article views including HTML views, PDF and ePub downloads, according to the available data) and Abstracts Views on Vision4Press platform.
Data correspond to usage on the plateform after 2015. The current usage metrics is available 48-96 hours after online publication and is updated daily on week days.
Initial download of the metrics may take a while.