Fig. 6.
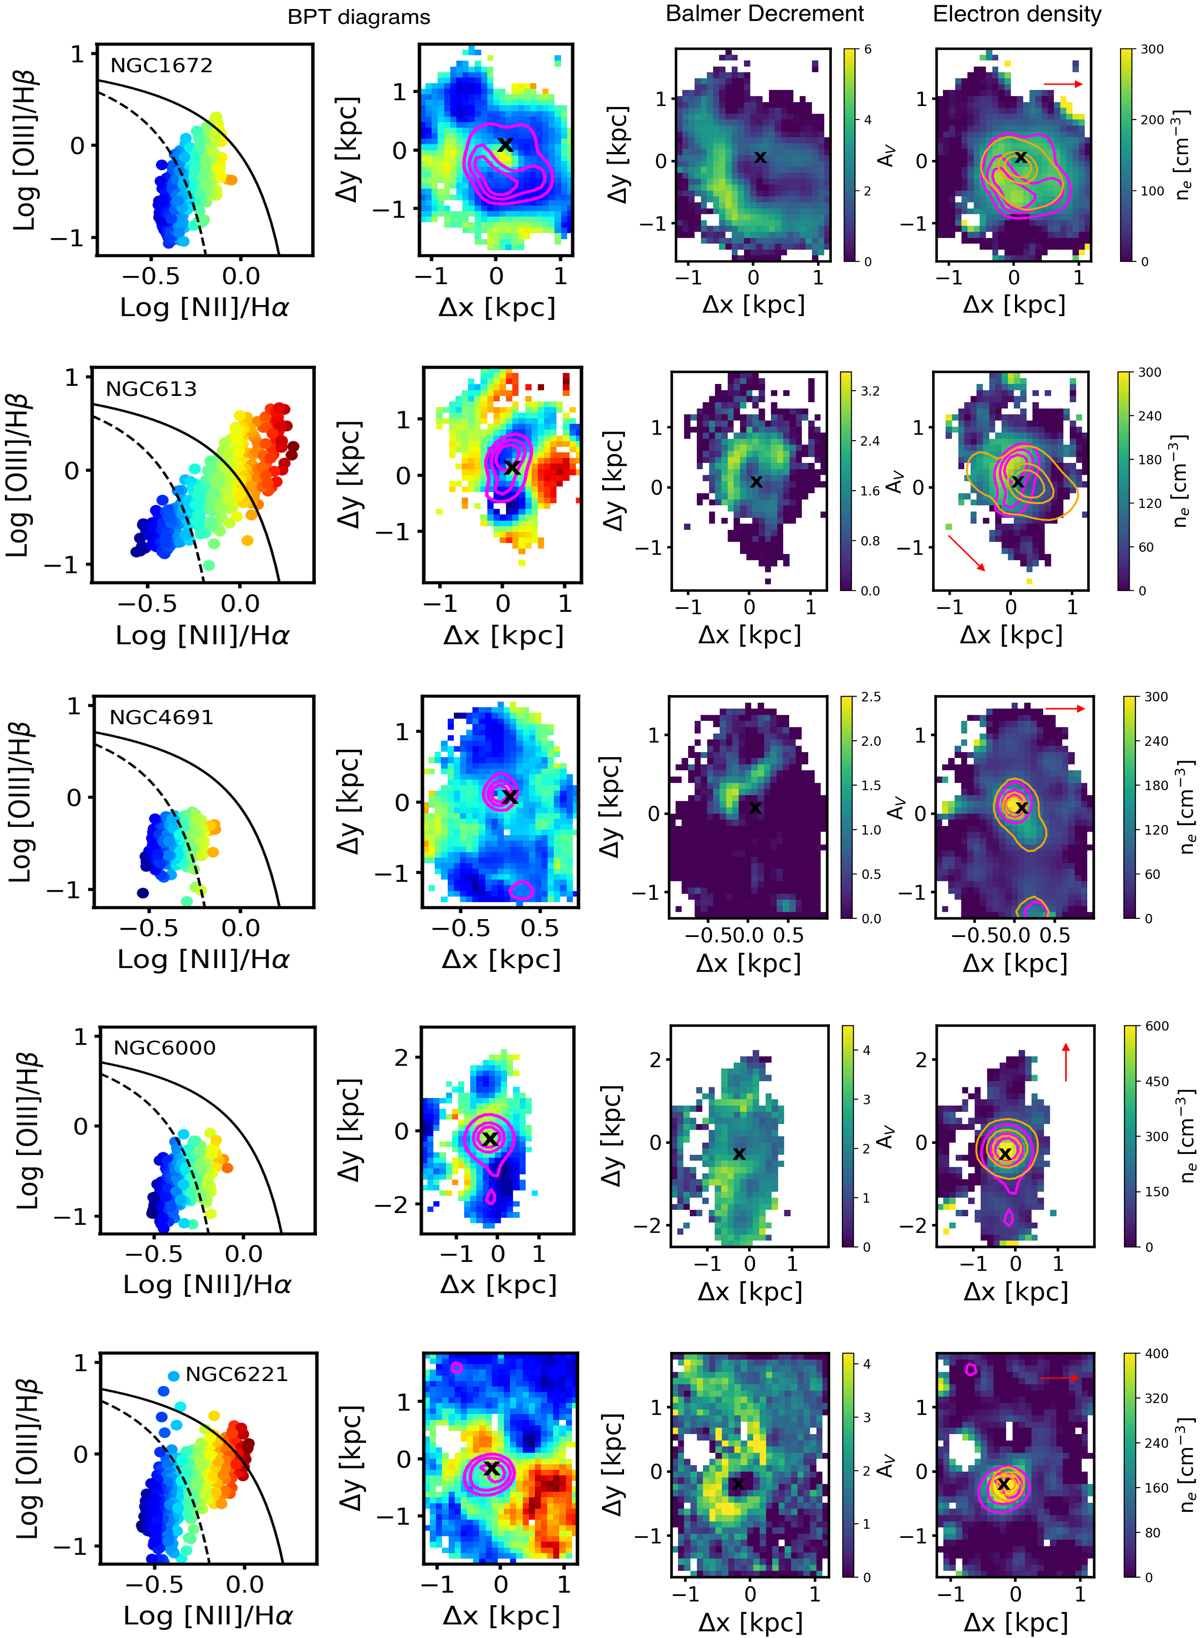
From left to right: data points from each pixel in the S7 FOV on a BPT diagram colour-coded based on the [N II]/Hα flux ratio, corresponding to the spatially resolved BPT map, extinction map, and density map for targets (from top to bottom) NGC 1672, NGC 613, NGC 4691, NGC 6000, and NGC 6221. As in Fig. 4, the magenta and orange contours represent the Hα and [O III] emission at levels 30%, 50%, and 80% of the peak. The red arrow in the density maps indicate north. In all the cases, the narrow Hα contours in magenta almost fall under the star forming region of the BPT diagram showing that there is no strong contribution from the AGN in these areas. All the targets in this figure also show a spatial correlation between sites of high star formation (from the narrow Hα contours) and high density.
Current usage metrics show cumulative count of Article Views (full-text article views including HTML views, PDF and ePub downloads, according to the available data) and Abstracts Views on Vision4Press platform.
Data correspond to usage on the plateform after 2015. The current usage metrics is available 48-96 hours after online publication and is updated daily on week days.
Initial download of the metrics may take a while.