Fig. 4.
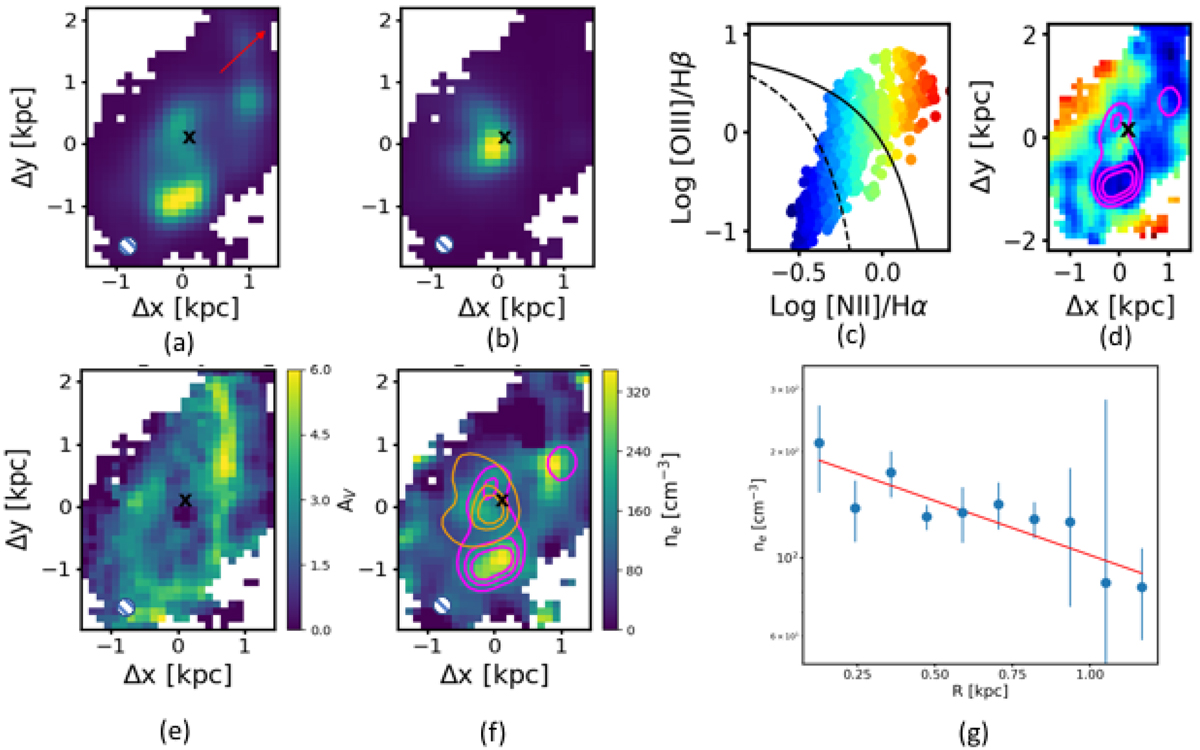
Analysis maps of NGC 1365 shown here as an example. Panels a and b: narrow Hα and [O III]λ5007 flux maps showing the star forming and NLR ionization regions in the host galaxy of NGC 1365, respectively. The red arrow indicates north and the black cross in the centre shows the position of the AGN. Panels c and d: BPT diagram with each point representing the data from every pixel in the S7 FOV, colour-coded on the scale of the [N II]/Hα flux ratio, and the corresponding position of these data points in the image. The spatially resolved BPT map shows the regions ionized by AGN and/or shocks and star formation. The solid and the dotted black line in panel c correspond to the extreme starburst Kewley et al. (2001) line and the Kauffmann et al. (2003) classification, respectively. The magenta contours represent the Hα emission from panel a at levels 30%, 50%, and 80% of the peak, showing that the clumps in the Hα map are indeed sites of star formation. Panel e: extinction map derived from the Hβ/Hα line ratio showing the obscuring regions in NGC 1365. Panel f : electron density map derived from the [S II]λ6716/[S II]λ6731 line ratio (see Sect. 3.2 for further details). The overlaid magenta contours represent the narrow Hα emission from panel a and the orange contours represent the [O III] emission from panel b at levels 30%, 50%, and 80% of the peak. The contour locations show that the electron density is high in sites of star formation. Panel g: electron density profile as a function of radius from the central AGN (black cross on the maps). The blue data points represent the profiles derived from the map itself and red line shows the best fit model assuming an exponential profile (see Sect. 4 for details). The stripped ellipse in the lower left corner of the maps in panels a, b, e and f illustrates the PSF during the observations.
Current usage metrics show cumulative count of Article Views (full-text article views including HTML views, PDF and ePub downloads, according to the available data) and Abstracts Views on Vision4Press platform.
Data correspond to usage on the plateform after 2015. The current usage metrics is available 48-96 hours after online publication and is updated daily on week days.
Initial download of the metrics may take a while.