Fig. 2.
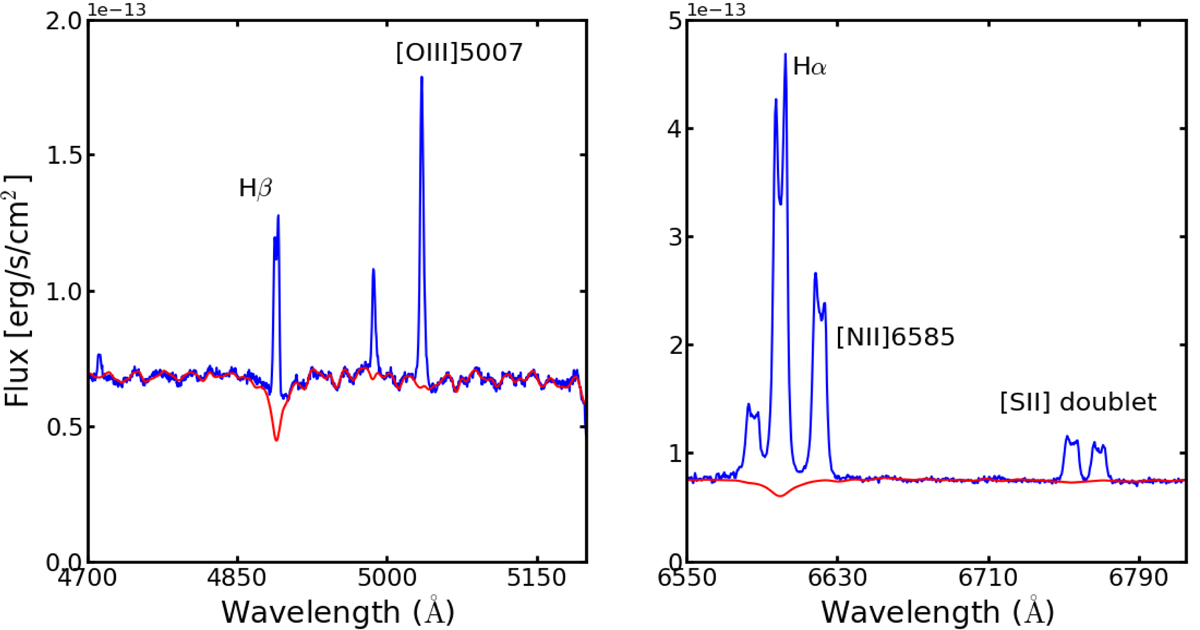
Stellar continuum fitting in the blue and red spectra of NGC 1365, one of the galaxies targeted by the S7 survey. The flux calibrated raw spectrum (blue curve) and the stellar continuum fit to the spectrum using pPXF (red curve) are shown. Left panel: integrated blue spectrum extracted from the entire S7 FOV and zoomed in the region around Hβ and [O III]λ4959,5007 emission lines. Right panel: spectra in the red cube zoomed in the region around [N II]λ6549,6585, Hα, and the [S II] doublet. The x-axis in both the panels shows the observed wavelength.
Current usage metrics show cumulative count of Article Views (full-text article views including HTML views, PDF and ePub downloads, according to the available data) and Abstracts Views on Vision4Press platform.
Data correspond to usage on the plateform after 2015. The current usage metrics is available 48-96 hours after online publication and is updated daily on week days.
Initial download of the metrics may take a while.