| Issue |
A&A
Volume 618, October 2018
|
|
|---|---|---|
| Article Number | A150 | |
| Number of page(s) | 15 | |
| Section | Stellar structure and evolution | |
| DOI | https://doi.org/10.1051/0004-6361/201731265 | |
| Published online | 26 October 2018 | |
Spectroscopic identification of INTEGRAL high-energy sources with VLT/ISAAC⋆
1
Laboratoire AIM (UMR 7158 CEA/DRF – CNRS – Université Paris Diderot), Irfu/Département d’Astrophysique, CEA-Saclay, 91191 Gif-sur-Yvette Cedex, France
e-mail: This email address is being protected from spambots. You need JavaScript enabled to view it.
2
Institut Universitaire de France, 103 Bd Saint-Michel, 75005, Paris, France
3
APC, Université Paris Diderot, CNRS/IN2P3, CEA/Irfu, Observatoire de Paris, 10 Rue Alice Domon et Léonie Duquet, 75205 Paris Cedex 13, France
4
Space Science Laboratory, 7 Gauss Way, University of California, Berkeley, CA 94720-7450, USA
5
Unidad de Astronomía, Universidad de Antofagasta, Avenida Angamos 601, Antofagasta 1270300, Chile
Received:
29
May
2017
Accepted:
24
July
2018
Abstract
Context. The INTEGRAL satellite has been observing the γ-ray sky for 15 years and has detected over 900 X-ray sources of various nature. However, more than 200 of these sources still lack precise identification.
Aims. Our goal is to reveal the nature of the high-energy sources detected by INTEGRAL. In particular, we want to improve the census of X-ray binaries.
Methods. Photometry and spectroscopy were performed in July 2012 on 14 INTEGRAL sources in near-infrared at the Very Large Telescope on the European Southern Observatory-UT3 telescope equipped with the ISAAC spectrograph. We used Ks images reaching to a depth of magnitude 18.5 to look for unique counterparts to high-energy detections to check for both extended sources and photometric variability. The analysis of near-infrared spectral features allows us to constrain the nature of these X-ray sources by comparing them to stellar spectra atlases.
Results. We present photometric and/or spectroscopic data for 14 sources (IGR J00465–4005, IGR J10447–6027, IGR J12489–6243, IGR J13020–6359, IGR J13186–6257, IGR J15293–5609, IGR J17200–3116, IGR J17404–3655, IGR J17586–2129, IGR J17597–2201, IGR J18457+0244, IGR J18532+0416, IGR J19308+0530, and IGR J19378–0617). We conclude that 5 of these are active galactic nuclei, 5 are cataclysmic variables, 2 are low- or intermediate-mass X-ray binaries, and 2 are Be high-mass X-ray binaries.
Key words: infrared: stars / X-rays: binaries / binaries: general
Based on observations made with ESO Telescopes at the La Silla Paranal Observatory under programme ID 089.D-0181(A).
© ESO 2018
1. Introduction
The INTEGRAL satellite has been observing the high-energy sky between 15 keV and 10 MeV for 15 years. However, the nature of the sources detected at high energies is often uncertain and requires further observations at low energies in optical and near-infrared (nIR) wavelengths. This is why a significant fraction (∼20%) of the INTEGRAL detections still need better constraints to have a robust identification. According to the catalogue of INTEGRAL detections published by Bird et al. (2016), it is expected that a majority of the unknown sources are active galactic nuclei (AGN) and high-energy binaries; the latter are binary star systems that host an accreting compact object.
High-energy binaries fall into three main categories depending on the compact object and the mass of the companion star: cataclysmic variables (CV), low-mass X-ray binaries (LMXB), and high-mass X-ray binaries (HMXB). While LMXBs host either a neutron star (NS) or a black hole (BH), CVs host a white dwarf; both have a low-mass companion star (typically M ≤ 1 M⊙). High-energy radiation is released through accretion of matter from the companion star overflowing its Roche lobe. An accretion disc can form around the compact object and feed it gradually, which often leads to transient behaviour. The less common intermediate-mass X-ray binaries (IMXBs) have a companion of mass between 1 and 10 M⊙ and the accretion process is similar to that of LMXBs. For the sake of consistency with the literature and especially Bird et al. (2016), we group IMXBs with LMXBs.
The HMXBs host a massive star (typically M ≥ 10 M⊙), around which orbits either a NS or a BH. Two main subcategories exist among HMXBs, based on the evolutionary phase of the companion star. In Be-types (BeHMXB), the secondary is a fast-rotating main-sequence O/B star that sheds matter from its equator as a consequence of high centrifugal force. A decretion disc thus forms around the companion star. The accretion of matter occurs when the compact object passes through that disc. Supergiant binaries (sgHMXB) host an evolved O/B supergiant star that feeds a compact object with matter through an intense stellar wind, driven by its tremendous luminosity. The sensitivity of INTEGRAL at higher energies made it possible to differentiate two new subclasses of sgHMXBs, as reviewed in Chaty (2013). Obscured HMXBs are intrinsically absorbed (NH > 1023 cm−2), while supergiant fast X-ray transients (SFXTs) show short and intense bursts of high-energy radiations.
Precisely identifying high-energy sources requires further observations, for which the nIR domain is well adapted. Firstly, many INTEGRAL sources (later called IGRs) lie near the Galactic plane, where optical radiation is absorbed by dust while infrared is not. Secondly, most of a binary’s nIR emission comes from the companion star or the accretion disc, which is ideal to identify their nature by constraining its spectral type.
In this paper, we present a sample of 14 IGR sources (Table 1) for which we performed nIR photometry and/or spectroscopy. We aim to confirm a unique nIR counterpart for each of these IGRs and provide additional constraints on their nature such as the spectral type of companion stars in X-ray binaries. The IBIS instrument on board INTEGRAL has a wide field of view, but does not have enough spatial resolution to associate accurately an optical/nIR counterpart to the high-energy detections. Precise X-ray localization is thus given by either Chandra, XMM-Newton, or Swift telescopes. Section 2 describes nIR photometric and spectroscopic observations by the European Southern Observatory (ESO), along with data reduction processes. Section 3 compiles all the previously published results on the sources along with the new results of our nIR observations. In Sect. 4 we discuss the results and outcomes of these observations before concluding in Sect. 5.
Positions and uncertainty of the X-ray detections of the IGR sample.
2. Observations
The observations were performed in 2012 (P.I. S. Chaty) on a sample of 14 INTEGRAL sources (programme ID 089.D-0181(A), see Table 1). Both nIR photometry and spectroscopy were performed at ESO in Chile on the 8 m Very Large Telescope Unit 3 Nasmyth A (VLT/UT3) equipped with the ISAAC instrument. The atmospheric conditions at the time of the observations were satisfactory and delivered an average seeing of 0ʺ̣7 in the Ks band.
2.1. Photometry
Near-infrared images were obtained through a Ks standard filter (1.98–2.35 μm). The field of view for individual images was 2ʺ̣5 × 2ʺ̣5 with a pixel scale of 0.148″. For each source, five frames were taken. Each frame was acquired with a random spatial offset (10″ in average) that follows the jitter acquisition method standardly used in nIR observations.
Data reduction was performed with standard Image Reduction and Analysis Facility (IRAF1) procedures. After dark subtraction and flat-field correction, the sky value was estimated and subtracted through the median of the five jittered images taken on each source. The images were then aligned based on precise astrometry and averaged to optimize the signal-to-noise ratio (S/N).
Aperture photometry was performed with the IRAF.apphot.qphot tool to derive the apparent Ks magnitudes. The counts were compatible with the linearity regime of the detector. The flux was integrated in a circle around the source (typically of radius 1ʺ̣2) and corrected for background estimated in an annulus {with inner and outer radii of 2″ and 3″, respectively. The size of the integration circle and background annulus were individually chosen to minimize sky contribution and pollution from nearby stars. Eight photometric standard stars (Table 2) were used to compute the average zero-point of photometry at the date of acquisition (Zp = 0.972 ± 0.056). To correct for extinction, we used the value2 estimated for Paranal by ESO : κKs = 0.07 mag airmass−1. The magnitudes we derived are available in Table 3, along with the log of our observations.
Standard stars used to calibrate the photometry.
Log of our photometric and spectroscopic acquisitions.
Summary of the identifications derived in this study with VLT/ISAAC nIR data.
2.2. Spectroscopy
Long-slit spectroscopy was acquired with ISAAC in short wavelength spectroscopy-low resolution mode (SWS-LR). The 0ʺ̣6 slit was used to obtain a spectral resolution of R = 750 in the K band (1.8–2.5 μm) providing a dispersion of 7.14 Å per pixel. The full width of narrow OH lines from sky emission were measured to be 26 ± 1 Å at 22 000 Å, which is compatible with the theoretical instrumental resolution of R = 750. For each source, eight spectral frames were taken. Each spectra was acquired with a slight spatial offset (∼30″) along the slit, following the ESO nodding procedure.
Data reduction was also performed with standard IRAF tools. Each spectrum was corrected by dark and flat frames. The overall sky value was estimated with the median of the eight spectra and then subtracted. Each spectrum was isolated via IRAF.apall package with respect to its local background. The trace of the spectra was fitted with a seventh order Tchebyshev polynomial. The eight extracted spectra were then combined through a median to correct for cosmic rays.
Atmospheric absorption was corrected on each reduced spectrum using Molecfit (Kausch et al. 2015; Smette et al. 2015). This radiation transfer tool fits the atmospheric features based on meteorological parameters on the date acquisitions were performed. As the spectral types of the observed stars were unknown, telluric correction via standard stars would have added artefacts due to spectral differences between standard and observed stars. However, the lower detector response towards 20 000 Å leads to a poor fit of the underlying CO2 telluric feature and introduces a residual artefact on almost all of our spectra.
A first wavelength solution was derived using the argon and xenon lamp spectra provided by the standard calibration procedure in ESO for ISAAC. The task IRAF.identify allowed us to derive a solution with a RMS of 0.15 Å. However, after reviewing OH sky lines for individual sources, we noticed that the wavelengths were shifted by a constant that spans from 10 to 50 Å depending on the source. We thus derived an individual wavelength zero-point correction for each source using eight prominent OH lines.
2.3. Astrometry
Good astrometric calibration is crucial to find nIR counterparts to high-energy detections. While images acquired with ISAAC for photometry also came with astrometric calibration, it was not precise enough. We refined the astrometry solution with the help of GAIA (Graphical Astronomic Image Analysis) by matching the positions of the sources in each field of view with data from 2MASS Point Source Catalogue (PSC) and/or Gaia DR1. Sources for which only spectra were acquired have noticeably more uncertainty in their astrometric calibration, since the calibration was performed on a single exposure that is taken before every batch of spectra for slit positioning. The RMS for each astrometric calibration is given in Table 1.
3. Results
Observational data obtained with VLT/ISAAC are used for several purposes. First, the photometric data allowed us to produce deep nIR images around the high-energy positions of the IGR sources. This was a way to check for blended or fainter sources and provide unambiguous counterparts for IGRs. Second, the good spatial resolution of ISAAC allowed us to distinguish extended sources, thus greatly helping the identification process. Third, accretion-driven sources are prone to photometric variability, which is verified by comparing our results to nIR photometry from the literature, mostly found in the 2MASS PSC. The analysis of spectral features (compiled in Table 5) allowed us to identify extragalactic sources from the redshift of recognizable emission lines such as hydrogen 2.166 μm Brackett (7–4; Brγ). As for the Galactic sources, we compared the features in their spectrum to spectral atlases (Kleinmann & Hall 1986; Hanson et al. 1996, 2005; Ramirez et al. 1997; Lenorzer et al. 2002; Harrison et al. 2004) to derive their spectral type.
Results of spectroscopy on IGR sources.
3.1. Distance estimate of X-ray binaries
After deriving the spectral type of the companion star and its Ks magnitude, we can estimate its distance using the hydrogen column density found in the literature, along with typical effective temperatures and stellar radii ranges from the spectral type. For our calculations, we use tabulated data from Allen’s Astrophysical Quantities (Cox 2000) linking spectral type to effective temperature and radius.
Let m* and M* be the apparent and absolute magnitudes of the considered stars, d the distance in parsec, and A the extinction. Then the distance modulus is
 (1)
(1)
If we set  as the luminosity of the stars in the K band, we also have
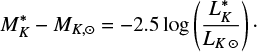 (2)
(2)
Such luminosity is proportional to the surface area of emission and the spectral emissivity in the K band, that is
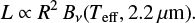 (3)
(3)
We can then isolate the distance and write
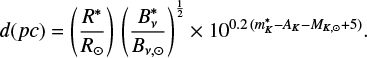 (4)
(4)
We estimate AK with the following formula: AV = NH/2.21 × 1021 cm−2 (Guver & Ozel 2009) and AK = 0.09 × AV (Whittet & Bowey 2003). We note that the distance estimate we obtain is rather rough, since small changes in temperature or radius affect it drastically, especially when considering giant stars or hot B-type stars. Moreover, we do not take into account the cases in which the binary has an accretion disc that participates in the nIR flux, such that our estimates are a lower limit on the distance.
3.2. Active galactic nuclei
3.2.1. IGR J00465–4005
First discovered by Bird et al. (2010) with the IBIS gamma-ray imager on board INTEGRAL, this source coincides with the highly absorbed galaxy ESP 39607 at redshift z = 0.201 present in the NASA Extragalactic Database (NED). Monet et al. (2003) reported optical magnitudes R = 17.3 and B = 17.8, while the infrared magnitudes given in 2MASS (Skrutskie et al. 2006) are as follows: J = 16.379 ± 0.129, H = 15.844 ± 0.164 and K = 14.845 ± 0.133. Various parameters were then derived in Landi et al. (2010b) by fitting Swift/XRT data with a double power law. The intrinsic absorption is NH ∼ 2.4 × 1023 cm−2, the photon index Γ ∼ 2.5, and the 2–10 keV flux is approximately 1.2 × 10⁻¹² erg cm−2 s−1. Masetti et al. (2010) provided optical spectroscopy in which the authors detect features redshifted at z = 0.201 from a Seyfert 2 galaxy.
Our imaging data show a single point-like source in the Swift 4ʺ̣26 error circle in an otherwise clear field of view (Fig. A.1a). This allowed us to attribute a nIR counterpart and derive a magnitude of Ks = 14.820 ± 0.059. This value is compatible with 2MASS J00462068–4005491 (0ʺ̣1 apart from one another). There is no significant difference from the K magnitude provided by 2MASS.
The overall smooth nIR spectrum presents a single, recognizable feature that we attribute to a redshifted hydrogen Paschen (7–4; Paα 1.875 μm) emission line (Fig. B.1) at z = 0.202 ± 0.002. The Brγ line is shifted out of our spectral range, therefore the redshift was only estimated on the Paα line.
We thus confirm the extragalactic nature of IGR J00465–4005 and estimate its redshift to be z = 0.202 ± 0.002. At this distance, the 2–10 keV X-ray luminosity is 9.3 × 1043 erg s−1. Along with the high column density, this is compatible with a Seyfert 2 galaxy as previously suggested.
3.2.2. IGR J10447–6027
Originally discovered by Leyder et al. (2008) when INTEGRAL was observing the region of Eta Carina, it was first associated with a young stellar object (YSO). This hypothesis was rejected by Fiocchi et al. (2010) with Chandra observations that allowed these authors to isolate a single point-like source of X-rays. Fiocchi et al. used an absorbed power law with an extra 0.2 keV thermal component to fit the X-ray data. The 0.2–10 keV flux is 1.7 ± 0.3 × 10⁻¹² erg cm−2 s−1 and the photon index is 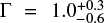 . The column density is thought to be very high (NH ∼ 2 × 1023 cm−2), which is consistent with the fact that no optical counterpart is present in the USNO-B1.0 catalogue, which indicates a rather red source. A nIR counterpart was then found in 2MASS (2MASS J10445192–6025115, J = 15.308, H = 14.967 ± 0.103, and K = 13.977 ± 0.098).
The 0ʺ̣65 Chandra error circle allowed us to isolate a single nIR counterpart in ISAAC data (Fig. A.1b) with a magnitude of Ks = 14.100 ± 0.060, which is consistent with the value for 2MASS J10445192–6025115; this source is however 0ʺ̣3 apart from our candidate, probably because of the presence of another nearby 2MASS source. The spectrum shows two prominent emission lines that are consistent with redshifted hydrogen Brγ and Paα at z = 0.047 ± 0.001 (Fig. B.1).
We then conclude that IGR J10447–6027 is an AGN at z = 0.047 ± 0.001. The 0.2–10 keV X-ray luminosity at this distance is 8.4 × 1042 erg s−1. This X-ray luminosity and the high column density are compatible with a Seyfert 2 galaxy.
3.2.3. IGR J18457+0244
Detected for the first time by Bird et al. (2010), follow-up observations by Swift (Landi et al. 2010b) and XMM-Newton (Bodaghee et al. 2012) allowed the latter authors to pinpoint a single 2MASS counterpart (2MASS J18454039+0242088, J = 16.244, H = 15.274 ± 0.136, K = 14.643 ± 0.122), even though this counterpart is only outside the 2.5″ XMM-Newton 90% confidence radius. The study led by Bodaghee et al. (2012) reveals a possible 4.4 ks oscillation and a slightly redshifted iron Kα line although both significances are low. It is suggested that this source is most likely an AGN, but needs further observations to reject totally the hypothesis of it being an absorbed X-ray pulsar because of potential periodic modulation at high energies. Refined XMM-Newton astrometry provides better positioning (see Table 1) for this source with an error circle of 2ʺ̣16 (Rosen et al. 2016).
At this position we find a single nIR counterpart that corresponds to 2MASS J18454039+0242088 (Fig. A.1k). Our deep K-band images reveal an axisymetric extended source that has a bright centre and dimmer wings of dimensions 2ʺ̣5 × 6ʺ̣5 (Fig. 1a). The centre of the extended source lies less than 0ʺ̣1 away from the 2MASS position. The Ks magnitude is 14.6 ± 0.2, which is compatible with no variability from the 2MASS value, and the K-band spectrum does not reveal any particular feature (Fig. B.1).
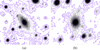 |
Fig. 1. Contours around the nIR counterparts of the AGNs identified through imaging. The fields of view are 14″ × 14″; north is up and east is left. Panel a: IGR J18457+0244. Panel b: IGR J18532+0416. |
A smooth spectrum suggests a synchrotron origin, perhaps due to IGR J18457+0244 seen flaring. Adding the fact that the Ks image reveals an extended source, we suggest this source is the counterpart of the high-energy detections and is very likely to be an AGN.
3.2.4. IGR J18532+0416
The detection of this source was first reported in Bird et al. (2010) and then localized with Swift-XRT (Fiocchi et al. 2011). Follow-up observations with XMM-Newton (Bodaghee et al. 2012) allowed them to further constrain the position of the source and associate it with 2MASS J18531602+0417481 (J = 16.488, H = 15.15 ± 0.093, K = 13.864 ± 0.072); this is the only source compatible with the position uncertainty of 2ʺ̣5. Bodaghee et al. (2012) fitted the XMM-Newton spectrum by a power law with an additional Gaussian to account for a Kα line. The spectrum is compatible with a photon index Γ = 1.4 ± 0.1 and a column density NH = 1.98 ± 0.08 × 10²² NH. The X-ray flux at 0.2–12 keV is 1.46 × 10⁻¹² erg cm−2 s−1. A feature near 6 keV is likely to be a redshifted Kα line at z = 0.051, suggesting an AGN although the S/N is poor. However, a faint periodic signal at 1408 s might be present in the light curve, which if confirmed would rather suggest that this source is an HMXB with an accreting NS. A new astrometric solution is available in 3XMM-DR7 (Table 1) and gives an updated position along with a 90% error circle of 1ʺ̣14.
The ISAAC image reveals that no nIR source falls in the new XMM-Newton error circle (Fig. A.1l). We find that the previous counterpart 2MASS J18531602+0417481 (source #1) is an extended source that is very likely a galaxy (Fig. 1b). However, it lies 1ʺ̣7 away from the new XMM-Newton position. The Ks = 13.968 ± 0.060 is compatible with the 2MASS value. The nIR image also reveals a very faint source (#2, Ks > 19) 1ʺ̣1 away from the XMM-Newton position. Spectroscopy was performed on #1 and reveals no particular feature (Fig. B.1). We note that extending the 90% error circle to a 3σ circle of 1ʺ̣6 for the XMM-Newton position and 0ʺ̣24 for the 2MASS object (#1), both candidates are viable counterparts.
IGR J18532+0416 is thought to be either an AGN or a HMXB. If we assume candidate #1 is the counterpart, it would then be an AGN. The fact that we spatially resolve the galaxy is consistent with the suggested redshift of 0.051 derived in X-rays. If we assume instead that candidate #2 is the counterpart, we would identify it as an HMXB. Its faint magnitude associated with the column density and a fiducial BV companion star would place this source between 64 and 80 kpc, right outside the Milky Way. This makes candidate #2 very unlikely to be the counterpart to IGR J18532+0416, thus we conclude that candidate #1 is its counterpart and that it is an AGN.
Our nIR imaging thus favours IGR J18532+0416 being an extragalactic source and more precisely an AGN at redshift z = 0.051 as derived from X-ray observations. Its 0.2–12 keV X-ray luminosity would be about 1.6 × 1043 erg s−1 at this distance.
3.2.5. IGR J19378–0617
The first detection by INTEGRAL was reported by Molkov et al. (2004), before a slightly adjusted position is given by Bird et al. (2007). The authors already suggested the detection of a Seyfert 1 AGN. Further Swift observations lead to a better positioning of the source and an extended nIR counterpart falls inside the 3ʺ̣5 error circle (2MASX J19373299–0613046, J = 12.673 ± 0.018, H = 11.598 ± 0.083, K = 10.721 ± 0.038). This source matches with SS 422/1H 1934-063 given in the catalogue from Molkov et al. (2004). It is identified as a Seyfert 1.5 galaxy at z = 0.011, and is already known as a radio (NVSS J193733–061304) and X-ray source (1RXS J193732.8-061305). Rodriguez et al. (2008) fit a Swift spectrum using a power law and derived a column density NH = 0.15 ± 0.05 × 1022 cm−2 and a photon index Γ = 2.5 ± 0.2, indicating a soft and not intrinsically absorbed source.
The Ks image shows a rather bright, isolated source that lies inside the Swift error circle (Fig. A.1n). Associated with 2MASS J19373301–0613047, our source lies about 0ʺ̣25 away; the slight separation could be due to our lack of a good quality photometry image. The ISAAC K-band spectrum of IGR J19378–0617 shows a single emission line (Fig. B.1) attributed to a redshifted hydrogen Brγ at z = 0.011 ± 0.001, which is consistent with the results of the previous studies. We confirm the extragalactic nature of IGR J19378–0617, an AGN located at z = 0.011 ± 0.001.
3.3. Cataclysmic variables
3.3.1. IGR J12489–6243
This source was first detected by INTEGRAL/IBIS as reported by Bird et al. (2010). Better spatial localization was obtained with Chandra (Tomsick et al. 2012). However, two X-ray candidates were found near the 4ʹ̣1 INTEGRAL error circle: one inside (1ʹ̣4) and the other right outside (5ʹ̣42). But because the closest source is too soft, the latter is more likely to be the actual counterpart. The authors fit the Chandra spectrum of IGR J12489–6243a with a power law, which indeed indicates a very hard photon index of  and a column density lower than 1.2 × 1022 cm−2. The 2–10 keV flux is 5.3 × 10⁻¹³ erg cm−2 s−1. This strongly supports a Galactic origin for IGR J12489–6243a and is likely to be either a CV or an HMXB.
In our 2012 ISAAC observations on IGR J12489–6243a, we find a point-like source at the position given by Chandra, which centroid lies inside the 90% error circle (Fig. A.1c). This is the only counterpart we find in the ISAAC image. The only catalogued counterpart is CXOU J124846.4-623743: the closest 2MASS source is located more than 3″ away. The Ks magnitude is 14.724 ± 0.060. The K-band spectrum reveals three emission lines: He I 2.058 μm, He I 2.162 μm, and Brγ (Fig. B.3a). The S/N does not allow us to identify any other features. According to Hanson et al. (1996), few OB stars show both He I 2.058 μm and Brγ in emission and when they do, they also present hydrogen’s Pfund series in emission. The fact that IGR J12489–6243 does not have any Pfund emission leads us to think it is rather a K–M main-sequence star, although it does not show the CO absorption series.
Given the hardness of X-ray emissions and the variability detected by INTEGRAL, this source could very well be a cataclysmic binary, that is a low-mass main-sequence star orbiting a white dwarf. There is a caveat however in the fact that the nIR counterpart does not show the series of absorption lines due to 12CO that is often seen in K–M stars. A possible explanation could be that the companion star depleted its atmosphere into the white dwarf (see Sect. 4.2) or that the nIR emission is dominated by the accretion disc. We suggest a distance of 250–730 pc for a K–M main-sequence companion star. That would correspond to a 2–10 keV luminosity between 4–30 × 1030 erg s−1, which is compatible with an accreting CV.
3.3.2. IGR J15293–5609
Tomsick et al. (2012) used a Chandra spectrum of IGR J15293–5609 to fit a power law and derive a column density  cm−2 along with a photon index
  , which favours a Galactic origin. The authors fit the spectral energy distribution (SED) from infrared to optical with no IR excess and derived an effective temperature between 4200 and 7000 K. According to the parallax given in the Sydney Observatory Galactic Survey (Fresneau et al. 2007), this source is located at 1.56 ± 0.12 kpc. It was thus possible to estimate the radius of the star to be between 12.0 and 16.4 R⊙, such that Tomsick et al. (2012) suggested this is a binary hosting an early KIII giant companion. Given the distance, the authors suggested the 0.3–10 keV luminosity of
  erg s−1 is consistent with the accretor being a white dwarf.
During the 2012 ISAAC run we only performed nIR spectroscopy for this source since its SED was already well known. A single source lies inside the 0ʺ̣64 Chandra circle and its position (Fig. A.1f) is consistent with 2MASS J15292939–5612133 (J = 9.620 ± 0.026, H = 8.962 ± 0.022, K = 8.747 ± 0.024, located 0ʺ̣1 away). The K-band spectrum shows the 12CO and 13CO series in absorption; these features are only seen in cooler G, K, and M stars (Fig. B.3b). The lack of hydrogen Brγ rules out a class G or early K star. However, the presence of the absorption lines Na I 2.21 μm and Ca I 2.26 μm in close proportions to those of CO leads the identification towards a main-sequence star, rather than an evolved red giant. In particular, the equivalent width ratio of CO(2-0) to both Na 2.21 μm and Ca 2.26 μm as determined in Ramirez et al. (1997) is a strong indicator of the luminosity class; we derive a ratio of CO/(Na+Ca) of  , which is perfectly consistent with a late-K main-sequence star.
There a discrepancy between spectroscopic and both photometric and parallax measurements; the only agreement is on the K spectral class, corresponding to an effective temperature below 5000 K.
Assuming a KV secondary from nIR spectroscopy, the distance to the system would be between 45 and 85 pc and would instead yield a 0.3–10 keV X-ray luminosity of 1 − 4 × 1029 erg s−1: this would be on the low end of low-luminosity CVs (Reis et al. 2013).
Assuming a 1.56 kpc distance, the bright Ks magnitude can only be explained by a giant companion star. That would mean our spectrum shows an abnormal quantity of metals (Na, Ca, Mg) compared to the reference KIII star with solar or subsolar metallicity. In Ivanov et al. (2004), several spectra of K3III stars of increasing metallicity (–1.7 to 0.5 dex) are also shown to have slightly increasing Na 2.21 μm to CO(2–0) ratio. A KIII star of metallicity higher than 0.5 dex may match our spectroscopic observations. However, we lack reference spectra to confirm such a claim. Although in theory, several studies such as that led by Stehle & Ritter (1999) have predicted metal-enriched secondaries in CVs due to the exchange of metal-rich nova ejecta.
Both high energy and nIR suggest that IGR J15293–5609 is a CV. However, there is an uncertainty on the secondary star. A KV star, highly compatible with our ISAAC nIR spectroscopy, would indicate a close, low-luminosity CV. A KIII star would fit the previous distance estimate and be part of a CV of typical X-ray luminosity, but the secondary would then be abnormally metal rich.
3.3.3. IGR J17200–3116
Masetti et al. (2006) reported an optical counterpart to the INTEGRAL detection (Walter et al. 2004) thanks to a refined position given by Chandra. The presence of an Hα emission line and the overall reddened spectrum along with a column density of 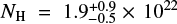 cm−2 (Tomsick et al. 2008) would be typical of INTEGRAL absorbed HMXB systems. However, Esposito et al. (2014) used XMM-Newton data to fit a power law with an extra 1.2 keV black body to derive a photon index of 0.81 ± 0.06, a 1–10 keV flux of 2.74×10⁻¹¹ erg cm−2 s−1, and a column density NH = 1.31 ± 0.07 cm−2. The authors also detected a 326 s X-ray pulse period. The pulse period is slow for a typical NS inside an LMXB, while the hard photon index is compatible with both HMXB and CV.
We find a single, bright counterpart just inside the Chandra error circle in the ISAAC field of view (Fig. A.1g). Its Ks magnitude is 12.202 ± 0.058. Our source lies less than 0ʺ̣1 away from 2MASS J17200591–3116596 (J = 13.581 ± 0.056, H = 12.334 ± 0.057, K = 11.983 ± 0.043). Our Ks measurement is slightly dimmer than expected from 2MASS (0.176 mag in Ks), which would indicate that this source is variable. The K-band spectrum of this source reveals the 12CO absorption series after 2.3 μm (Fig. B.3c), which is typical of a low-mass star (Kleinmann & Hall 1986). Since the CO absorption is well visible up to the 6th series, we suggest this is a K star rather than an M star. Two helium emission lines are present, along with a Mg I absorption line. The low intensity of the Mg I line and the absence of other lines such as Na I and Ca I favours an evolved KIII star rather than a main-sequence star.
The hard photon index, slow pulse period, and KIII companion star are all compatible with a low-mass star orbiting around a white dwarf. We suggest IGR J17200–3116 is a symbiotic CV. Assuming a KIII star, the distance would be between 4–8 kpc. That would yield a 1–10 keV X-ray luminosity between 0.7−2.8 × 1035 erg s−1. We note that Orio et al. (2007) found symbiotic stars with similar luminosities.
3.3.4. IGR J17404–3655
The first INTEGRAL detection was reported in Bird et al. (2007) and a Swift position was reported later in Landi et al. (2008) along with the fit of the Swift spectrum with an unabsorbed power law (Γ = 0.24, 2–10 keV flux of 1.2 × 10⁻¹¹ erg cm−2 s−1). Further optical observations led Masetti et al. (2009) to identify this source as an LMXB. The authors estimated its distance to be 9.1 kpc and thus its luminosity to be 1.2 × 1035 erg s−1. However, the Chandra spectrum presented in Tomsick et al. (2009) is compatible with a photon index  and is too hard for a typical LMXB; the authors suggested it is more likely to be caused by an HMXB hosting a highly magnetized NS.
A single point-like source lies within the Chandra error circle (Fig. A.1h). It lies less than 0ʺ̣1 away from 2MASS J17402685–3655374 (J = 15.340 ± 0.094, H = 14.564, K = 14.194). ISAAC nIR spectrum shows the two emission lines of He I 2.058 μm and Brγ, along with a faint C IV emission line. This could correspond to a hot B-type star as shown in Hanson et al. (1996). However, such stars show Brγ and Pfund emission series after 2.3 μm in comparable strengths. This is not the case for IGR J17404–3655. We do not detect any Pfund line (Fig. B.3d), while the Brγ line is rather strong; that is stronger than the line we detect in IGR J13186–6257, which also shows Pfund emission (see Fig. B.2).
A study of CVs in the nIR domain by Harrison et al. (2004) revealed that their spectra do not always show the absorption series of 12CO that we usually see in cooler, less massive stars and that is still present the Brγ and He I lines mentioned above. In particular, the spectrum of IGR J17404–3655 resembles that of a K3–5V star orbiting a white dwarf. Thus, according to K-band spectroscopy, we would rather identify this source as a CV with a K3–5V companion star.
The hard high-energy spectrum along with the aforementioned nIR spectral features are compatible with IGR J17404–3655 being a CV with a K3–5V companion. This would represent a distance between 530 and 700 pc, for a 2–10 keV X-ray luminosity of 4–7 × 1032 erg s−1; these values are compatible with a CV.
3.3.5. IGR J17586–2129
Discovered by INTEGRAL (Bird et al. 2006) and further observed by Chandra (Tomsick et al. 2009), a power-law fit indicates a highly absorbed source (NH = 9−22 × 1022 cm−2) with a photon index of  . It coincides with a deeply reddened 2MASS source (2MASS J17583455–2123215, J = 11.380 ± 0.040, H = 9.530 ± 0.034, K = 8.437 ± 0.027) with I − Ks ∼ 7. The high absorption may indicate that it lies very far away, probably several kpc. Given a fiducial distance of 5 kpc, Tomsick et al. (2009) considered its 0.3–10 keV luminosity of 3 × 1034 erg s−1 to be too bright for a CV, and its hardness makes it more likely to be an HMXB rather than an AGN.
The high Ks magnitude and good localization of this source allow us to easily isolate it in the ISAAC K-band image (Fig. A.1i). The source lies less than 0ʺ̣1 away from 2MASS J17583455–2123215. We can clearly see the 12CO and 13CO absorption series after 2.3 μm. Although they are not as well defined as in the spectrum of IGR J17200–3116 (Fig. B.3e), we see the six CO absorption series and thus suggest it is a K star. The spectrum shows a faint Na I absorption line. If this was a main-sequence star, the Na line should be more prominent and we should also detect Ca I and Mg I absorption lines. We suggest this spectrum is compatible with an evolved KIII star.
The high column density directly translates into AV = 40–100. The bright K magnitude combined with the type KIII star hypothesis would yield a distance between 130 and 300 pc for the lowest column density estimate (NH ≃ 9 × 1022 cm−2). These distances give X-ray luminosities that are on the low end for CVs. This scenario is very unlikely since such high absorption may not only entirely be due to interstellar medium, but also to intrinsic absorption from material near the accretor. If we then consider instead the average extinction AV = 6.48 in a 5′ radius around the source (Schlafly & Finkbeiner 2011), we derive a distance of 1.1 kpc and a 0.3–10 keV luminosity of 3 × 1033 erg s−1; these values are more consistent with classical values for CVs.
Along with the lack of calcium and sodium in absorption, the nIR spectrum suggests a KIII star that disagrees with the HMXB hypothesis. Even though this source has high intrinsic absorption that could suggest an LMXB, the hard photon index points towards a CV. We suggest this source is more likely to be a symbiotic CV with a KIII companion.
3.4. Low- or intermediate-mass X-ray binaries
3.4.1. IGR J17597–2201
Reported by Lutovinov et al. (2003), this INTEGRAL source is first localized with XMM-Newton (Walter et al. 2006). It is subject to type I X-ray bursts detected by JEM-X (Brandt et al. 2007). This suggests the presence of a NS inside an LMXB. The 4″ XMM-Newton error circle allowed Chaty et al. (2008) to identify several counterpart candidates with NTT/EMMI. Among these, the candidate identified as #1 has optical and infrared magnitudes that are consistent with an LMXB nature. Further Chandra observations by Ratti et al. (2010) allowed these authors to isolate a single counterpart in i′ band (NTT/EMMI), which corresponds to candidate #1 in Chaty et al. (2008). The average X-ray flux at 0.2–12 keV taken from 3XMM DR7 is 2.4 × 10⁻¹² erg cm−2 s−1.
A single source is present inside the Chandra 0ʺ̣64 error circle on the ISAAC image (Fig. A.1j), which corresponds to the aforementioned candidate. Its Ks magnitude is 13.091 ± 0.058. There are no catalogued optical/infrared sources for this star. While its spectrum has an overall low signal, features such as the Brγ and 12CO series are visible in absorption. Weaker absorption lines (Na I and Ca I) are possibly present with the caveat of low S/N (Fig. B.4a). According to Kleinmann & Hall (1986), the presence of both Brγ and 12CO series in absorption indicates a giant star. Based on the strength ratio of these features (EWBrγ/EWCO(2–0) ∼ 0.4), we suggest this star is between a G8 and K0 type.
Using the average extinction AV = 16.99 in a radius of 5′ around the source (Schlafly & Finkbeiner 2011), we derive a distance of 5.6 kpc, which corresponds to an average 0.2–12 keV X-ray luminosity of 1.1 × 1036 erg s−1. This is a typical value for an LMXB. Both X-ray and nIR data agree that IGR J17597–2201 is an LMXB with a G8–K0III companion star.
3.4.2. IGR J19308+0530
First reported in Bird et al. (2006), follow-up observations with Swift (Rodriguez et al. 2008) and Chandra (Ratti et al. 2010) allowed the latter to localize the position of the X-ray source with an accuracy of 0ʺ̣64 and identify the nIR counterpart (2MASS J19305075+0530582, J = 9.617 ± 0.032, H = 9.245 ± 0.023, K = 9.130 ± 0.023). This star is very bright and is reported to be of spectral type F8 (McCuskey 1949). The Swift spectrum (Rodriguez et al. 2008) is dominated by a soft black-body component at 0.2 keV with NH <s 1.5 × 1021 cm−2, corresponding to a 2–10 keV flux of 3.3 × 10⁻¹ erg cm−2 s−1. This is expected in neutron star LMXBs and IMXBs in a state of quiescence (Jonker et al. 2004). A study from Ratti & Grunsven (2013) provides phase-resolved optical spectroscopy of this source. They measured an orbital period of 14.7 h and a mass ratio q = 1.78 ± 0.04, for a secondary of type F4V. The authors suggested the primary is most likely a white dwarf, but do not entirely rule out a NS. Its distance would be between 300–450 pc and its 2–10 keV X-ray luminosity between 0.5–4 × 1030 erg s−1 (Ratti et al. 2010).
The ISAAC field of view on this position reveals an isolated bright source (Fig. A.1m) situated at the position of 2MASS J19305075+0530582. K-band spectroscopy shows a prominent Brγ line in absorption (Fig. B.4b) along with faint absorption lines from metals (Na I, Ca I). The signal of the spectrum does not allow us to constrain well enough the strength ratio of the metals to Brγ; as such, our spectrum is compatible with types F8–G0V–III according to Kleinmann & Hall (1986). Our data is thus compatible with an intermediate-mass star and we confirm the identification from Ratti & Grunsven (2013) of F4V, thus IGR J19308+0530 is an IMXB.
3.5. High-mass X-ray binaries
3.5.1. IGR J13020–6359
Bird et al. (2006, 2007) first identified this source as an HMXB based on its proximity with 2RXP J130159.6-635806, which is an accreting pulsar according to Chernyakova et al. (2005). The authors also mentioned a noticeable variability and derive a column density of 2.48 × 1022 cm−2. A follow-up study with Swift/XRT by Rodriguez et al. (2009) shows that the spectral characteristics of IGR J13020–6359 are compatible with this source being an accreting pulsar. Assuming a distance between 4–7 kpc (Chernyakova et al. 2005) its 2–10 keV luminosity is about 8–9 × 1034 erg s−1 , which is typical of high-mass stars accreting on pulsars (Bodaghee et al. 2007).
The ISAAC imaging reveals there is a single source within the 0ʺ̣39 XMM-Newton error circle (Fig. A.1d). This source is associated with a rather bright 2MASS object (2MASS J13015871–6358089, J = 12.962 ± 1.339, H = 12.047 ± 0.031, K = 11.346 ± 0.088, 0.1″ away). We measure a magnitude Ks = 11.373 ± 0.058, showing no significant variability from the 2MASS value. Its nIR spectrum shows features leading towards a high-mass main-sequence star (Fig. B.2): first the presence of the two emission lines He I 2.058 μm and Brγ and second hydrogen’s distinctive Pfund series (25–5 to 17–5) after 2.350 μm. According to the spectral atlas given by Hanson et al. (1996), the presence of both He I and Brγ in emission (the latter being more intense than He I) is only seen in BVe stars. Also, the Pfund series in emission is reported in Lenorzer et al. (2002) to be present in B0–6Ve stars, which further confirms that this source is an early-type star.
The distance was previously estimated in Chernyakova et al. (2005) with the rough spectral type and magnitude of the companion star (B-type star at 4–7 kpc for Teff ∼ 10 000 K and 6–10 solar radii). Our data suggest it might be closer, between 0.8 and 2.3 kpc, using the column density derived in X-rays, temperatures between 12 000 and 25 000 K, and a radius of 2–3.6 R⊙, which are typical values for B0–6V stars.
We conclude 2MASS J13015871–6358089 is the counterpart to the X-ray emission and is of spectral type B0–6Ve. This agrees with the high-energy characteristics of IGR J13020–6359, which we suggest is an HMXB with an accreting pulsar and a B0–6Ve companion.
3.5.2. IGR J13186–6257
This source is first reported in Landi et al. (2008) and later associated with CXOU J131825.0-625815 (Tomsick et al. 2009); the position given by Chandra allowed Tomsick et al. to find the IR counterpart to be 2MASS J13182505–6258156 (J = 13.581, H = 12.689, Ks = 12.842 ± 0.050). The authors derive a column density of 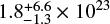 cm−2 although the local value could be from 2 × 10²² to 8.4 × 1023 cm−2, which resembles the characteristics of many INTEGRAL HMXBs.
A single counterpart is easily found among the ISAAC field of view on the edge of the 0ʺ̣64 Chandra position (Fig. A.1e). This counterpart is compatible with 2MASS J13182505–6258156, which is 0ʺ̣1 away. We obtain a Ks magnitude of 13.080 ± 0.058, which is 0.219 mag dimmer than expected from 2MASS, indicating a potentially variable source.
The nIR spectrum is very similar to that of IGR J13020–6359. However the signal is not as good. He I and Brγ are visible in emission, but the Pfund series is not as prominent and suffers from low S/N (Fig. B.2). To confirm its presence, we used a slightly different reduction method that favours signal at longer wavelengths.
The first reduction process treats each of the eight raw spectra individually before combining them. It is especially adapted for bright stars as there is no issue when extracting each spectra from the background. However, faint stars do not seem to benefit from this method since it is harder to estimate the trace over the entire range on a raw, single spectrum. The individual trace fitting is thus not as reliable. The second reduction process first combines the raw spectra to optimize the S/N. The fit of the trace gives better results at longer wavelengths, but sacrifices S/N at shorter wavelengths.
Using the second reduction method on IGR J13186–6257 reveals that the Pfund series in emission is definitely present. This is the only source in the sample that gave noticeably different results when comparing the two reduction processes. In particular, applying the second method to IGR J12489–6243 and IGR J17404–3655, both of which present He I and Brγ in emission, did not reveal any additional feature either Pfund in emission or 12/13CO in absorption.
IGR J13186–6257 is thus very likely to be a B0–6Ve star orbiting a compact object, together forming a BeHMXB. If we consider the uncertainty on the local value of column density, this heavily absorbed binary could be situated from 0.7 to 5.4 kpc.
4. Discussion
In this section we discuss the overall results of the nIR observations in comparison to the high-energy identifications and previous distributions of object types among the whole catalogue of INTEGRAL sources.
4.1. AGN candidates identified through imaging
Near-infrared imaging on IGR J18457+0244 and IGR J18532+0416 (Fig. 1) shows extended sources inside (or adjacent to) the high-energy error circles. These two sources do not present any particular features in their nIR spectrum, as opposed to the other AGNs presented in this paper. Even though their signal is rather low, hydrogen emission lines – if present – should still be detectable, as we easily detect hydrogen in IGR J00465–4005, an AGN of similar Ks luminosity. Since they are spatially resolved, their redshift is too low to shift the Brγ line out of our spectral range, which is why we are confident about the actual absence of features in their spectrum. We thus suggest that this source is associated with synchrotron emission, coming from flaring AGNs.
4.2. Abundance anomalies in cataclysmic variables
Near-infrared spectroscopy of IGR 12489–6243 and IGR J17404–3655 reveals both helium (He I 2.058 μm) and Brγ emission lines similar to OB secondaries in HMXB systems. However, the absence of the Pfund series in emission (see Sect. 3.5.2) leads us to doubt the massive star hypothesis, even though these sources do not show CO absorption as G- or K-type stars would.
The deciding factor comes from nIR spectroscopy on a sample of 12 CVs (Harrison et al. 2004) that show abundance anomalies. In particular, some of these sources lack CO absorption and have both He I 2.058 μm and Brγ emission, which is very similar to our results on the IGRs mentioned above.
Such spectra could be explained by rather old CVs in which the G/K-type secondary has had time to deplete its atmosphere (were CO absorption usually takes place) into the white dwarf. Helium and hydrogen emission lines would then come from the heated accretion disc rather than from the secondary star itself.
This relies on the fact that while single stars are rather well constrained in terms of element abundances and spectral features, the accreting phase in a binary system can drastically change these characteristics.
4.3. Source distribution
In Bird et al. (2016) is given the list of all the INTEGRAL detections so far, along with their nature when available. These sources are either AGNs (39%), L/IMXBs (14%), HMXBs (12%), or CVs (6%). For a total of 939 objects, 23% were still unidentified. Among our 14 sources, 13 are mentioned in Bird et al. (2016), while the last only appears in Bird et al. (2006) because the detection threshold was modified. Their distribution in the sky is shown in Fig. 2.
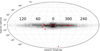 |
Fig. 2. Spatial distribution of the INTEGRAL sources identified in this paper. |
The two sets of data appear to be rather different from one another (see Fig. 3); however, they have a large gap in the total number of sources. To properly estimate how significant the differences are, we used the following method: First, we assume that the distribution in Bird et al. (2016) is representative of all the INTEGRAL sources (both identified and unidentified). Then, we build a statistical model by drawing 14 random sources multiple times (typically 106) following probabilities that are derived from our hypothesis (Eq. (5)) for each type of source,
 (5)
(5)
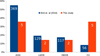 |
Fig. 3. Distribution of the 14 sources presented in this paper, alongside the 671 identified IGR sources presented in Bird et al. (2016). The left axis is normalized to the fraction (%) of the sources with respect to the total number of sources in their study, while the actual number of sources are indicated in white. |
The statistical model is thus made of the average  and the standard deviation σmod of the 106 draws, for each type of source. We finally perform a chi-square test (Eq. (6)) to compare our observed set of data nobs to the statistical model built from the set of data in Bird et al. (2016),
 (6)
(6)
The test returns χ2 = 15.98 and with 3 degrees of freedom the corresponding p-value (the probability that a sample from the model would present such a large difference) is 0.001. Since the threshold p-value for statistical significance is usually set to 0.05, this means our data is significantly different from the model. Figure 4 shows that while our number of LMXBs and HMXBs are statistically compatible with the results in Bird et al. (2016), we have a shortcoming of AGNs and CVs are over- represented.
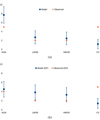 |
Fig. 4. Statistical models derived from the data in Bird et al. (2016) vs. our results. Panel a: comparison between the whole-sky model and our data. Panel b: comparison between the Galactic plane model (GP) and our data, both restricted to sources whithin ±15° from the GP. |
The lower number of AGNs can be explained by the fact that our study focussed on sources that are located within ±15° from the Galactic plane (except for one), while the sources in Bird et al. (2016) are scattered over the whole sky. We thus built another model, using only the sources that lie in the Galactic plane for both sets of data. This now concerns 412 sources from Bird et al. (2016) and 13 from our study.
The chi-square test using the new model returns χ2 = 12.56, and the associated p-value is 0.002 with 2 degrees of freedom since we added the Galactic plane constraint. While we now have a compatible number of AGNs, the high number of CVs in our data is still significantly different from what is expected (see Fig. 4).
There could be different explanations as for why we identified so many CVs. The initial hypothesis concerning the representativity of the Bird et al. (2016) catalogue could be wrong, which means the remaining >200 unidentified INTEGRAL sources would contain a larger percentage of CVs. This would be an interesting result since INTEGRAL discovered obscured sgHMXBs thanks to its high energy range and good sensitivity. Therefore, the aforementioned CVs would look like HMXBs at high energies and would most likely be intermediate polars, in which the white dwarf is highly magnetized, and present a harder high-energy spectrum than regular CVs. We note that four of our CVs were first suggested to be potential HMXBs based on high-energy data, and this confirms once again the necessity of multiwavelength studies to identify binary systems.
4.4. Current census of high-energy sources
We give an inventory of the various sources detected by INTEGRAL at high energies (Table 6). In addition to the previous studies (Liu et al. 2006, 2007; Coleiro et al. 2013; Bird et al. 2016), we take into account the results of the current paper. All these sources were cross-correlated since some are common to two or more catalogues. The total number of confirmed AGNs detected by INTEGRAL is 373, and represents about 31% of the IGR sources in the Galactic plane. There are currently 217 known LMXBs, 60 CVs, and 167 HMXBs. Among the latter, we can differentiate 70 BeHMXBs and 35 sgHMXBs 10 of which are SFXTs.
Census of high-energy sources.
The low statistics on the high-energy sources, and in particular on X-ray binaries, comes from the rather long and difficult identification process, for which multiwavelength observations are needed. The most crucial step is obtaining a good X-ray localization of the sources (typically < 1″ in the Galactic plane, <2″ in less crowded areas). Among the 288 IGR sources for which the nature is either uncertain or completely unknown, 251 (87%) have a localization that is less accurate than 2″, which in most cases do not find a single optical/nIR counterpart before the position is better constrained.
5. Conclusions
We presented nIR observations of 14 INTEGRAL sources with the VLT/ISAAC instrument. The photometric and spectroscopic data allowed us to pinpoint nIR counterparts to the high-energy detections and identify or better constrain the nature of the sources. Among these sources, there are 5 AGNs, 5 CVs, 2 BeHMXBs, and 2 I/LMXBs. While the proportions between types are not fully consistent with those published in Bird et al. (2016), we still expect that the remaining unidentified INTEGRAL sources contain a significant amount of AGNs, X-ray binaries, and CVs. This could be a great resource for the two latter, since the current census of binaries is not so high and would benefit from having more candidates with a well-constrained nature. In turn, this will help to perform population studies, derive accurate classifications, and answer more general questions on stellar evolution in binaries in the context of stellar merging endpoints and the detection of gravitational waves.
Acknowledgments
We thank the anonymous referee for careful reading and valuable input, which helped to improve this paper. We also thank Federico Garcia for his suggestions regarding several of the sources presented in this paper. This work was supported by the Centre National d’Etudes Spatiales (CNES). It is based on observations obtained with MINE: the Multiwavelength INTEGRAL NEtwork. This research has made use of the IGR Sources page maintained by J. Rodriguez & A. Bodaghee (http://irfu.cea.fr/Sap/IGR-Sources); data products from the Two Micron All Sky Survey, which is a joint project of the University of Massachusetts and the Infrared Processing and Analysis Center/California Institute of Technology, funded by the National Aeronautics and Space Administration and the National Science Foundation; data obtained from the 3XMM XMM-Newton serendipitous source catalogue compiled by the ten institutes of the XMM-Newton Survey Science Centre selected by ESA; the SIMBAD database and VizieR catalogue access tool, operated at CDS, Strasbourg, France; and NASA’s Astrophysics Data System Bibliographic Services, operated by the Smithsonian Astrophysical Observatory under NASA Cooperative Agreement NNX16AC86A.
IRAF is distributed by the National Optical Astronomy Observatories, which are operated by the Association of Universities for Research in Astronomy, Inc., under cooperative agreement with the National Science Foundation.
References
- Bird, A. J., Barlow, E. J., Bassani, L., et al. 2006, ApJ, 636, 765 [NASA ADS] [CrossRef] [EDP Sciences] [Google Scholar]
- Bird, A. J., Malizia, A., Bazzano, A., et al. 2007, ApJS, 170, 175 [NASA ADS] [CrossRef] [Google Scholar]
- Bird, A. J., Bazzano, A., Bassani, L., et al. 2010, ApJS, 186, 1 [NASA ADS] [CrossRef] [Google Scholar]
- Bird, A. J., Bazzano, A., Malizia, A., et al. 2016, ApJS, 223, 15 [NASA ADS] [CrossRef] [Google Scholar]
- Bodaghee, A., Courvoisier, T. J.-L., Rodriguez, J., et al. 2007, A&A, 467, 585 [Google Scholar]
- Bodaghee, A., Tomsick, J. A., & Rodriguez, J. 2012, ApJ, 753, 3 [NASA ADS] [CrossRef] [Google Scholar]
- Brandt, S., Budtz-Jørgensen, C., Gotz, D., Hurley, K., & Frontera, F. 2007, ATel, 1054 [Google Scholar]
- Chaty, S. 2013, AdSpR, 52, 2132 [Google Scholar]
- Chaty, S., Rahoui, F., Foellmi, C., et al. 2008, A&A, 484, 783 [NASA ADS] [CrossRef] [EDP Sciences] [Google Scholar]
- Chernyakova, M., Lutovinov, A., Rodriguez, J., & Revnivtsev, M. 2005, MNRAS, 364, 455 [Google Scholar]
- Coleiro, A., Chaty, S., ZuritaHeras, J. A., Rahoui, F., & Tomsick, J. A. 2013, A&A, 560, A108 [NASA ADS] [CrossRef] [EDP Sciences] [Google Scholar]
- Cox, A. N. 2000, Allen’s Astrophysical Quantities (New-York: AIP Press) [Google Scholar]
- Esposito, P., Israel, G. L., Sidoli, L., et al. 2014, MNRAS, 441, 1126 [Google Scholar]
- Fiocchi, M., Bassani, L., Bazzano, A., et al. 2010, ApJ, 720, 987 [NASA ADS] [CrossRef] [Google Scholar]
- Fiocchi, M., Landi, R., Bassani, L., et al. 2011, ATel, 3256, 1 [NASA ADS] [Google Scholar]
- Fresneau, A., Vaughan, A. E., & Argyle, R. W. 2007, VizieR Online Data Catalog: III/46 [Google Scholar]
- Guver, T., & Ozel, F. 2009, MNRAS, 400, 2050 [NASA ADS] [CrossRef] [Google Scholar]
- Hanson, M. M., Conti, P. S., & Rieke, M. J. 1996, ApJS, 107, 281 [Google Scholar]
- Hanson, M. M., Kudritzki, R.-P., Kenworthy, M. A., Puls, J., & Tokunaga, A. T. 2005, ApJS, 161, 154 [NASA ADS] [CrossRef] [EDP Sciences] [MathSciNet] [Google Scholar]
- Harrison, T. E., Osborne, H. L., & Howell, S. B. 2004, AJ, 127, 3493 [NASA ADS] [CrossRef] [Google Scholar]
- Ivanov, V. D., Rieke, M. J., Engelbracht, C. W., et al. 2004, ApJS, 151, 387 [NASA ADS] [CrossRef] [Google Scholar]
- Jonker, P. G., Galloway, D. K., McClintock, J. E., et al. 2004, MNRAS, 354, 666 [NASA ADS] [CrossRef] [Google Scholar]
- Kausch, W., Smette, S. N. A., Kimeswenger, S., et al. 2015, A&A, 576, A78 [NASA ADS] [CrossRef] [EDP Sciences] [Google Scholar]
- Kleinmann, S. G., & Hall, D. N. B. 1986, ApJS, 62, 501 [NASA ADS] [CrossRef] [Google Scholar]
- Landi, R., Masetti, N., Malizia, A., et al. 2008, ATel, 1539, 1 [NASA ADS] [Google Scholar]
- Landi, R., Bassani, L., Malizia, A., et al. 2010a, MNRAS, 403, 945 [Google Scholar]
- Landi, R., Malizia, A., Bazzano, A., et al. 2010b, ATel, 3078, 1 [NASA ADS] [Google Scholar]
- Lenorzer, A., Vandenbussche, B., Morris, P., et al. 2002, A&A, 384, 473 [NASA ADS] [CrossRef] [EDP Sciences] [Google Scholar]
- Leyder, J.-C., Walter, R., & Rauw, G. 2008, A&A, 477, L29 [Google Scholar]
- Liu, Q. Z., Vanparadijs, J., & Heuvel, E. 2006, A&A, 455, 1165 [NASA ADS] [CrossRef] [EDP Sciences] [Google Scholar]
- Liu, Q. Z., Vanparadijs, J., & Heuvel, E. 2007, A&A, 469, 807 [NASA ADS] [CrossRef] [EDP Sciences] [Google Scholar]
- Lutovinov, A., Walter, R., Belanger, G., et al. 2003, ATel, 155, 1 [NASA ADS] [Google Scholar]
- Masetti, N., Morelli, L., Palazzi, E., et al. 2006, A&A, 459, 21 [Google Scholar]
- Masetti, N., Parisi, P., Palazzi, E., et al. 2009, A&A, 495, 121 [NASA ADS] [CrossRef] [EDP Sciences] [Google Scholar]
- Masetti, N., Parisi, P., Palazzi, E., et al. 2010, A&A, 519, A96 [NASA ADS] [CrossRef] [EDP Sciences] [Google Scholar]
- McCuskey, S. W. 1949, ApJ, 109, 426 [Google Scholar]
- Molkov, S. V., Cherepashchuk, A. M., Lutovinov, A. A., et al. 2004, Astron. Lett., 30, 534 [NASA ADS] [CrossRef] [Google Scholar]
- Monet, D., Levine, S., Canzian, B., et al. 2003, AJ, 125, 984 [NASA ADS] [CrossRef] [Google Scholar]
- Orio, M., Zezas, A., Munari, U., Siviero, A., & Tepedelenlioglu, E. 2007, ApJ, 661, 1105 [Google Scholar]
- Ramirez, S. V., Depoy, D. L., Frogel, J. A., Sellgren, K., & Blum, R. D. 1997, AJ, 113, 1411 [NASA ADS] [CrossRef] [Google Scholar]
- Ratti, E. M., Bassa, C. G., Torres, M. A. P., et al. 2010, MNRAS, 408, 1866 [NASA ADS] [CrossRef] [Google Scholar]
- Ratti, E. M., Grunsven, V. J. T. F., Torres, M. A. P., et al. 2013, MNRAS, 431, L10 [Google Scholar]
- Reis, R. C., Wheatley, P. J., Gansicke, B. T., & Osborne, J. P. 2013, MNRAS, 430, 1994 [NASA ADS] [CrossRef] [EDP Sciences] [Google Scholar]
- Rodriguez, J., Tomsick, J. A., & Chaty, S. 2008, A&A, 482, 731 [Google Scholar]
- Rodriguez, J., Tomsick, J. A., & Chaty, S. 2009, A&A, 494, 417 [NASA ADS] [CrossRef] [EDP Sciences] [Google Scholar]
- Rosen, S. R., Webb, N. A., Watson, M. G., et al. 2016, A&A, 590, A1 [NASA ADS] [CrossRef] [EDP Sciences] [Google Scholar]
- Schlafly, E. F., & Finkbeiner, D. P. 2011, ApJ, 737, 103 [NASA ADS] [CrossRef] [Google Scholar]
- Skrutskie, M. F., Cutri, R. M., Stiening, R., et al. 2006, AJ, 131, 1163 [NASA ADS] [CrossRef] [Google Scholar]
- Smette, A., Sana, H., Noll, S., et al. 2015, A&A, 576, A77 [NASA ADS] [CrossRef] [EDP Sciences] [Google Scholar]
- Stehle, R., & Ritter, H. 1999, MNRAS, 309, 245 [Google Scholar]
- Tomsick, J. A., Chaty, S., Rodriguez, J., Walter, R., & Kaaret, P. 2008, ApJ, 685, 1143 [Google Scholar]
- Tomsick, J. A., Chaty, S., Rodriguez, J., Walter, R., & Kaaret, P. 2009, ApJ, 701, 811 [NASA ADS] [CrossRef] [Google Scholar]
- Tomsick, J. A., Bodaghee, A., Chaty, S., et al. 2012, ApJ, 754, 145 [NASA ADS] [CrossRef] [Google Scholar]
- Walter, R., Bodaghee, A., Barlow, E. J., et al. 2004, ATel, 229, 1 [NASA ADS] [Google Scholar]
- Walter, R., Heras, J. Z., Bassani, L., et al. 2006, A&A, 453, 133 [NASA ADS] [CrossRef] [EDP Sciences] [Google Scholar]
- Whittet, D. C. B., & Bowey, J. E. 2003, Observatory, 123, 320 [Google Scholar]
Appendix A: Finding charts
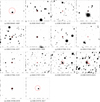 |
Fig. A1. Ks finding charts of IGR sources in this study. Each frame is 33″ × 33″; north is up and east is left. Red circles indicate the high-energy position at 90% confidence. |
Appendix B: Additional figures
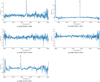 |
Fig. B1. K-band spectra of the INTEGRAL sources identified as AGN. Spurious features from residual artefacts are labelled in red. |
 |
Fig. B2. K-band spectra of the INTEGRAL sources identified as HMXBs. |
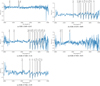 |
Fig. B3. K-band spectra of the INTEGRAL sources identified as CVs. |
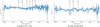 |
Fig. B4. K-band spectra of the INTEGRAL sources identified as LMXB/IMXBs. Spurious features from residual artefacts are labelled in red. |
All Tables
All Figures
|
Fig. 1. Contours around the nIR counterparts of the AGNs identified through imaging. The fields of view are 14″ × 14″; north is up and east is left. Panel a: IGR J18457+0244. Panel b: IGR J18532+0416. |
| In the text | |
|
Fig. 2. Spatial distribution of the INTEGRAL sources identified in this paper. |
| In the text | |
|
Fig. 3. Distribution of the 14 sources presented in this paper, alongside the 671 identified IGR sources presented in Bird et al. (2016). The left axis is normalized to the fraction (%) of the sources with respect to the total number of sources in their study, while the actual number of sources are indicated in white. |
| In the text | |
|
Fig. 4. Statistical models derived from the data in Bird et al. (2016) vs. our results. Panel a: comparison between the whole-sky model and our data. Panel b: comparison between the Galactic plane model (GP) and our data, both restricted to sources whithin ±15° from the GP. |
| In the text | |
|
Fig. A1. Ks finding charts of IGR sources in this study. Each frame is 33″ × 33″; north is up and east is left. Red circles indicate the high-energy position at 90% confidence. |
| In the text | |
|
Fig. B1. K-band spectra of the INTEGRAL sources identified as AGN. Spurious features from residual artefacts are labelled in red. |
| In the text | |
|
Fig. B2. K-band spectra of the INTEGRAL sources identified as HMXBs. |
| In the text | |
|
Fig. B3. K-band spectra of the INTEGRAL sources identified as CVs. |
| In the text | |
|
Fig. B4. K-band spectra of the INTEGRAL sources identified as LMXB/IMXBs. Spurious features from residual artefacts are labelled in red. |
| In the text | |
Current usage metrics show cumulative count of Article Views (full-text article views including HTML views, PDF and ePub downloads, according to the available data) and Abstracts Views on Vision4Press platform.
Data correspond to usage on the plateform after 2015. The current usage metrics is available 48-96 hours after online publication and is updated daily on week days.
Initial download of the metrics may take a while.