Free Access
Fig. 3.
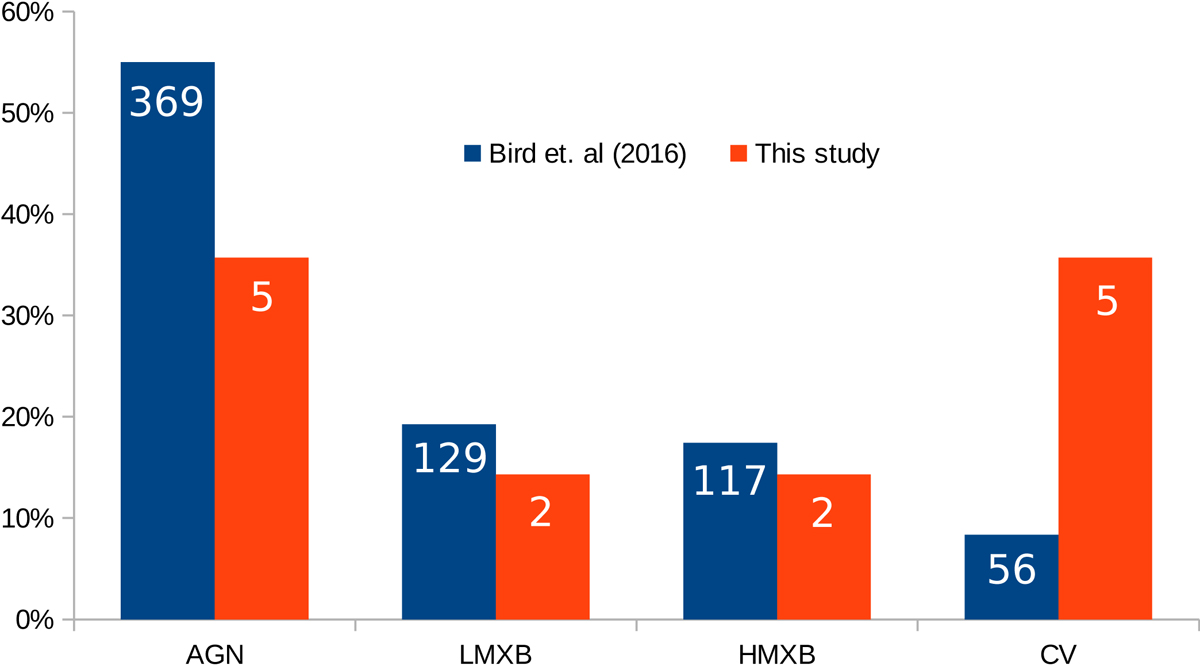
Distribution of the 14 sources presented in this paper, alongside the 671 identified IGR sources presented in Bird et al. (2016). The left axis is normalized to the fraction (%) of the sources with respect to the total number of sources in their study, while the actual number of sources are indicated in white.
Current usage metrics show cumulative count of Article Views (full-text article views including HTML views, PDF and ePub downloads, according to the available data) and Abstracts Views on Vision4Press platform.
Data correspond to usage on the plateform after 2015. The current usage metrics is available 48-96 hours after online publication and is updated daily on week days.
Initial download of the metrics may take a while.