Free Access
Fig. A1.
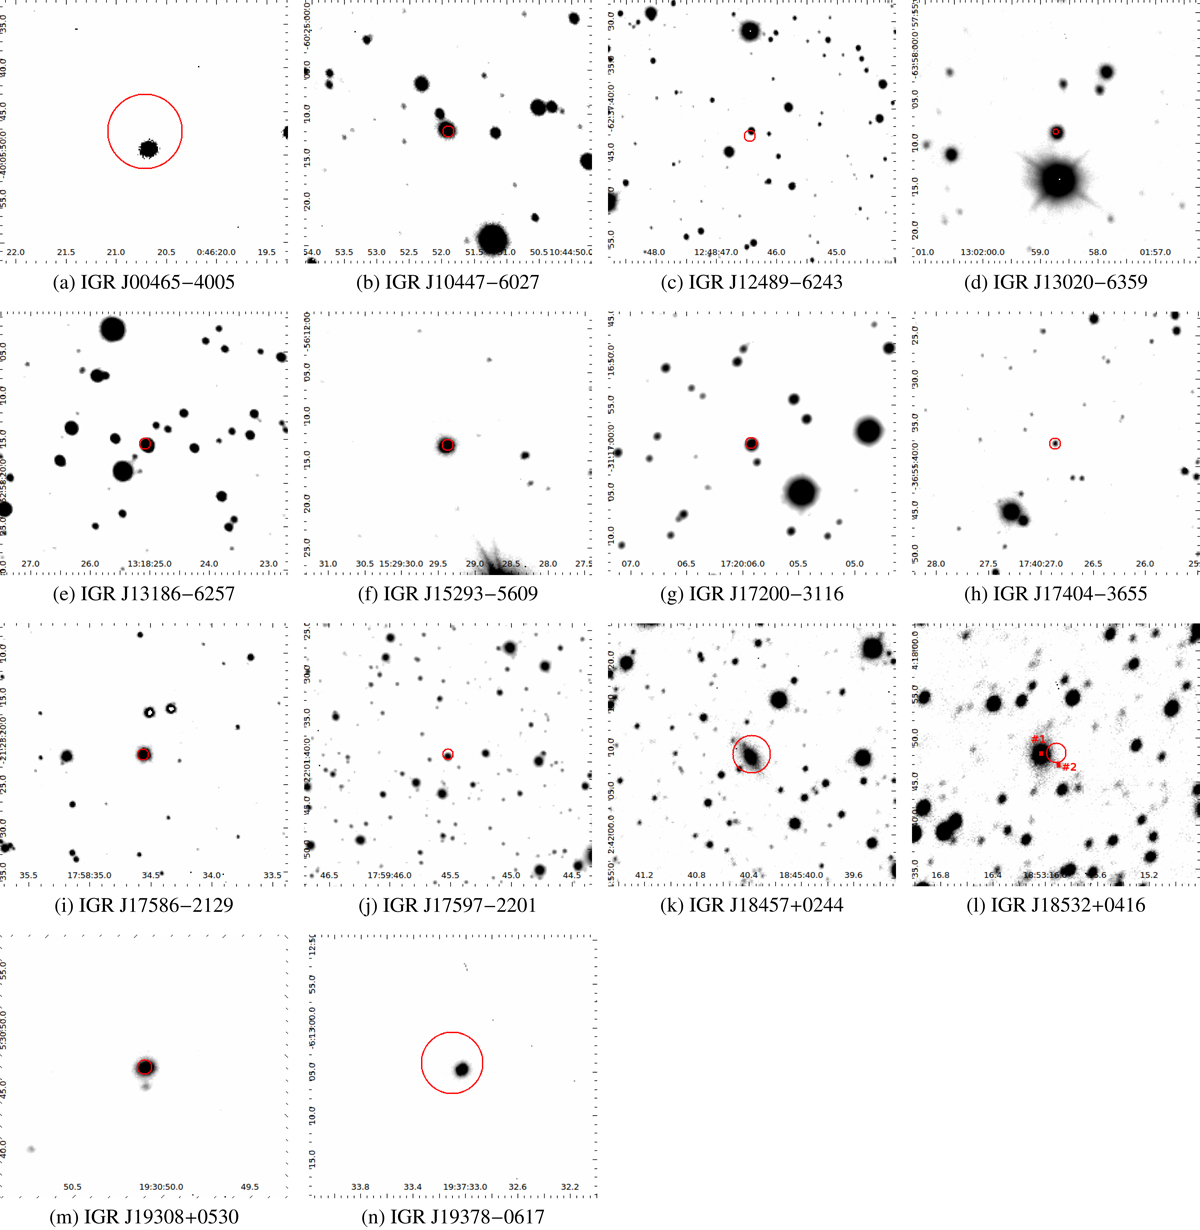
Ks finding charts of IGR sources in this study. Each frame is 33″ × 33″; north is up and east is left. Red circles indicate the high-energy position at 90% confidence.
Current usage metrics show cumulative count of Article Views (full-text article views including HTML views, PDF and ePub downloads, according to the available data) and Abstracts Views on Vision4Press platform.
Data correspond to usage on the plateform after 2015. The current usage metrics is available 48-96 hours after online publication and is updated daily on week days.
Initial download of the metrics may take a while.