Open Access
Fig. 7
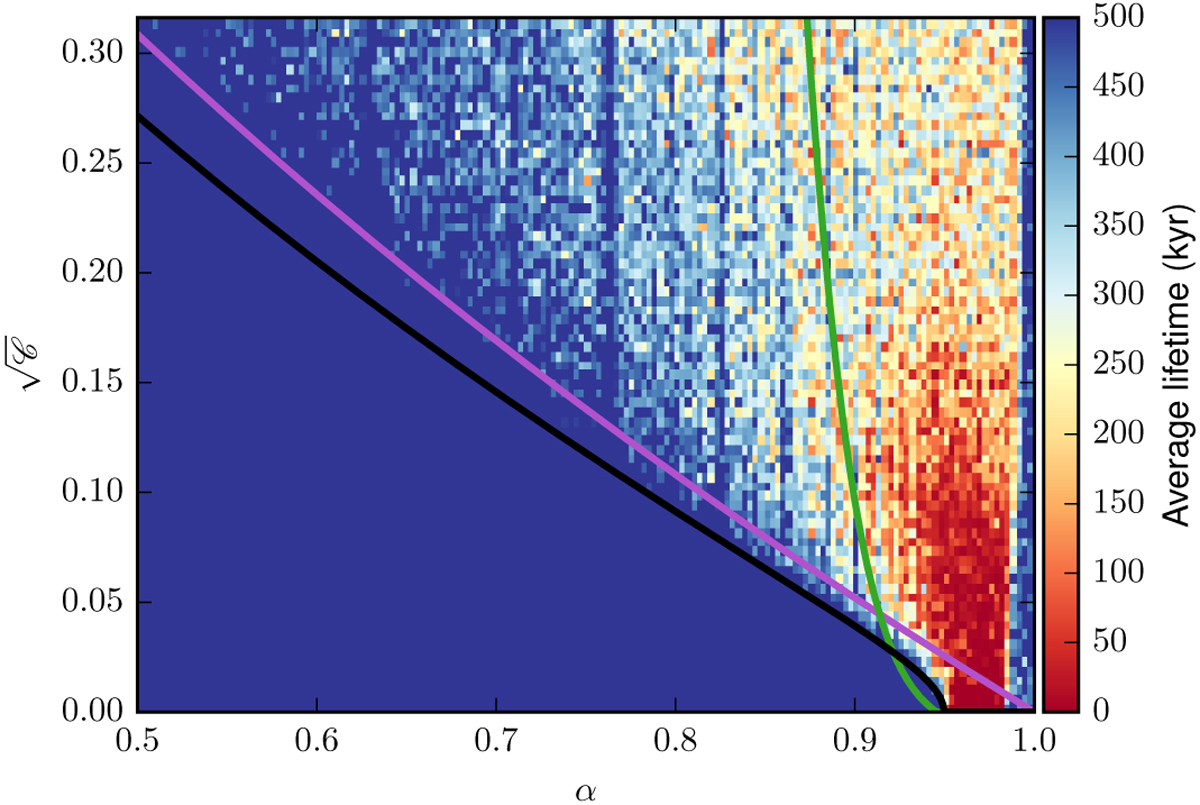
Average lifetime of the system as a function of α and ![]() . The parameters are similar to Fig. 4. Each bin represents an average over eight initial conditions. Dark blue implies that all integration ended at 500 kyr.
. The parameters are similar to Fig. 4. Each bin represents an average over eight initial conditions. Dark blue implies that all integration ended at 500 kyr.
Current usage metrics show cumulative count of Article Views (full-text article views including HTML views, PDF and ePub downloads, according to the available data) and Abstracts Views on Vision4Press platform.
Data correspond to usage on the plateform after 2015. The current usage metrics is available 48-96 hours after online publication and is updated daily on week days.
Initial download of the metrics may take a while.