Fig. 4
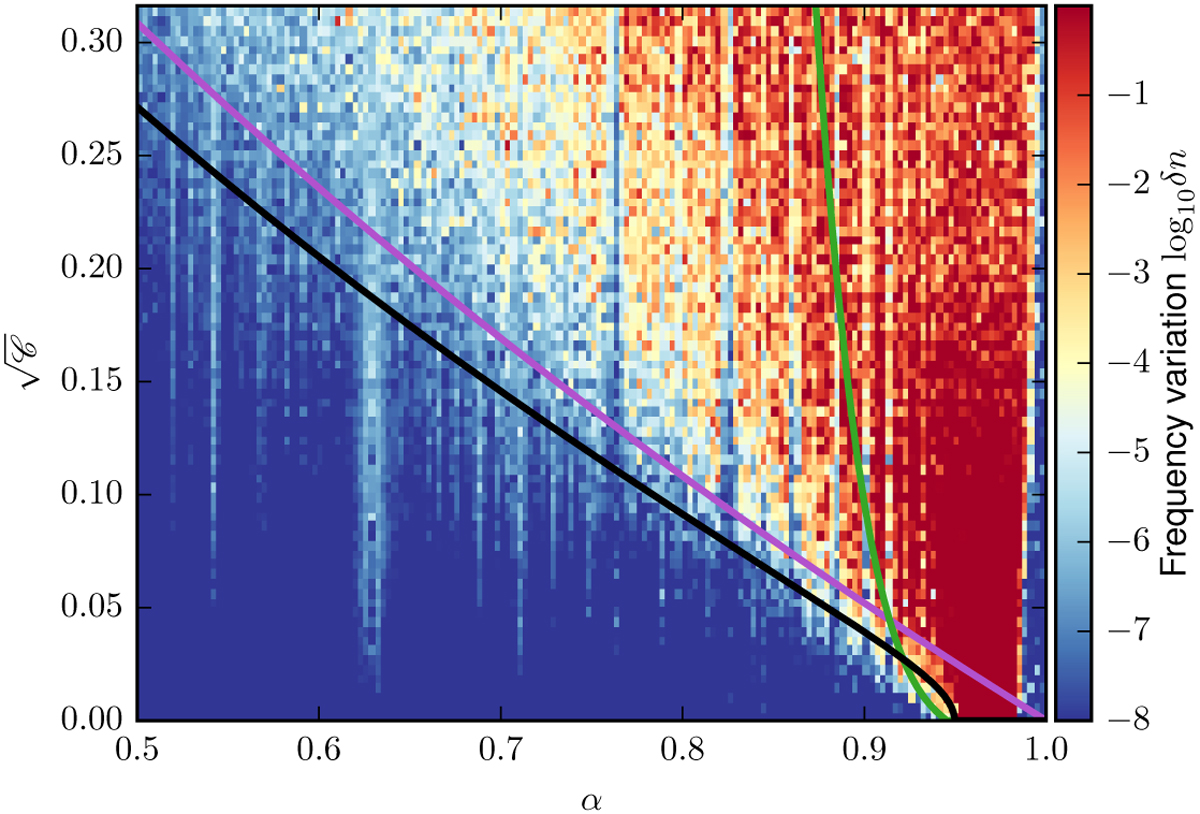
Frequency variation δn (31) for 1 00 000 initial conditions binned in a 160 × 75 grid with ε = 10−5 and γ = 1. The black curve is the Hill critical AMD ![]() (30), the purple curve is the collisional critical AMD Cc (Laskar & Petit 2017), and the green curve is the critical AMD obtained from the overlap of first-order MMR
(30), the purple curve is the collisional critical AMD Cc (Laskar & Petit 2017), and the green curve is the critical AMD obtained from the overlap of first-order MMR ![]() (Petit et al. 2017). Each bin is average over about eight initial conditions.
(Petit et al. 2017). Each bin is average over about eight initial conditions.
Current usage metrics show cumulative count of Article Views (full-text article views including HTML views, PDF and ePub downloads, according to the available data) and Abstracts Views on Vision4Press platform.
Data correspond to usage on the plateform after 2015. The current usage metrics is available 48-96 hours after online publication and is updated daily on week days.
Initial download of the metrics may take a while.