Open Access
Fig. 10
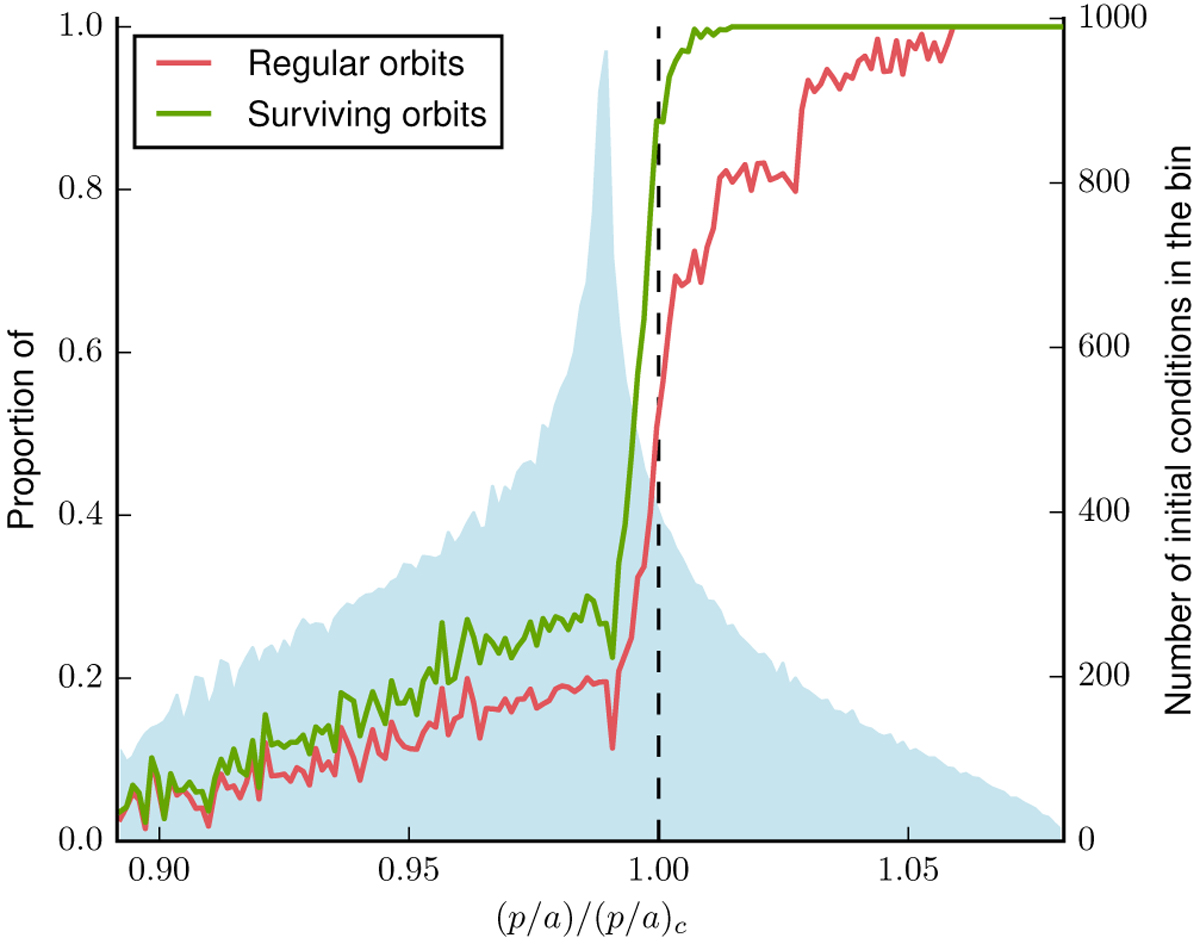
Proportion of orbits that survived for 500 kyr (green curve) and nonchaotic orbits (δn < 10−4; red curve) asa function of ![]() .
.![]() means that the initial condition verifies the Hill criterion. The light blue histogram represents the number of initial conditions in each of the 150 bins used to compute the fractions plotted.
means that the initial condition verifies the Hill criterion. The light blue histogram represents the number of initial conditions in each of the 150 bins used to compute the fractions plotted.
Current usage metrics show cumulative count of Article Views (full-text article views including HTML views, PDF and ePub downloads, according to the available data) and Abstracts Views on Vision4Press platform.
Data correspond to usage on the plateform after 2015. The current usage metrics is available 48-96 hours after online publication and is updated daily on week days.
Initial download of the metrics may take a while.