Fig. 1
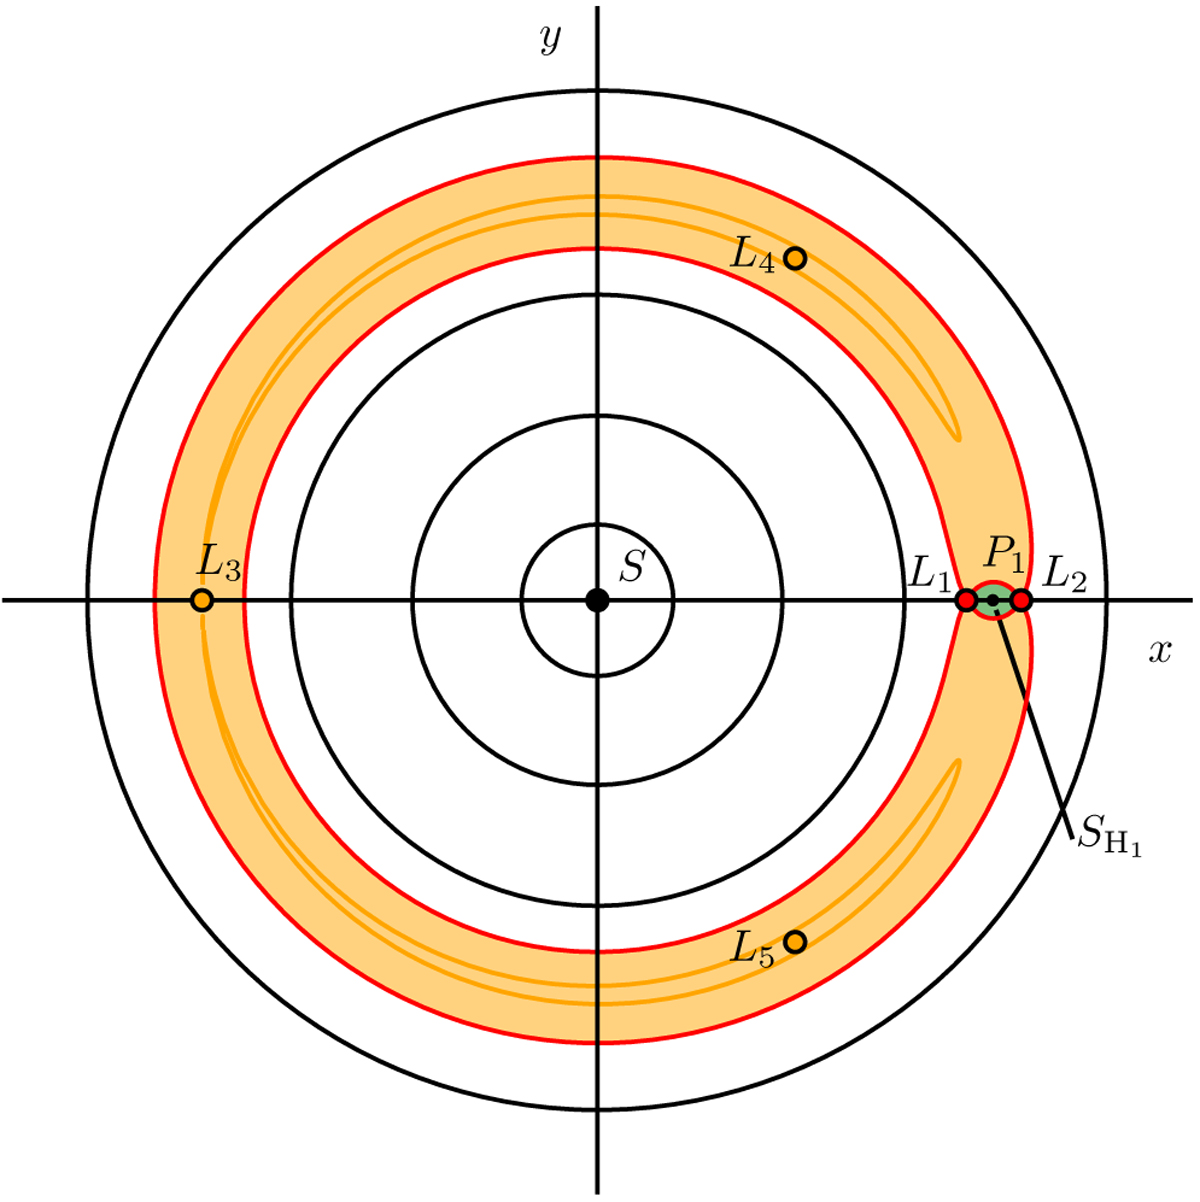
Some levels of the function R defined in (16) for ε = 10−3 and γ = 1 in the ![]() plane. The two red points correspond to the Lagrange points L1 and L2 and the three orange points to L3, L4, and L5. The orange-filled area corresponds to the region where R(x, y) < R(L1). The star S is at the origin, the planet P1 at (1,0), and (x,y) are the coordinates of the second planet. The green region
plane. The two red points correspond to the Lagrange points L1 and L2 and the three orange points to L3, L4, and L5. The orange-filled area corresponds to the region where R(x, y) < R(L1). The star S is at the origin, the planet P1 at (1,0), and (x,y) are the coordinates of the second planet. The green region ![]() represents the Hill sphere of the first planet.
represents the Hill sphere of the first planet.
Current usage metrics show cumulative count of Article Views (full-text article views including HTML views, PDF and ePub downloads, according to the available data) and Abstracts Views on Vision4Press platform.
Data correspond to usage on the plateform after 2015. The current usage metrics is available 48-96 hours after online publication and is updated daily on week days.
Initial download of the metrics may take a while.