| Issue |
A&A
Volume 617, September 2018
|
|
|---|---|---|
| Article Number | A118 | |
| Number of page(s) | 10 | |
| Section | Extragalactic astronomy | |
| DOI | https://doi.org/10.1051/0004-6361/201832794 | |
| Published online | 26 September 2018 | |
Restframe UV-to-optical spectroscopy of APM 08279+5255
BAL classification and black hole mass estimates★
1
INAF – Osservatorio Astronomico di Roma,
Via Frascati 33,
00040
Monte Porzio Catone (RM),
Italy
e-mail: francescogabriele.saturni@oa-roma.inaf.it
2
Space Science Data Center, Agenzia Spaziale Italiana,
Via del Politecnico snc,
00133
Roma,
Italy
3
Dip. di Fisica, Università degli Studi di Roma “Tor Vergata”,
Via della Ricerca Scientifica 1,
00133
Roma,
Italy
4
INAF – Osservatorio Astronomico di Brera,
Via Brera 28,
20121
Milano,
Italy
5
INAF – Osservatorio Astronomico di Trieste,
Via G. B. Tiepolo 11,
34143
Trieste,
Italy
6
Scuola Normale Superiore,
P.zza dei Cavalieri 7,
56126
Pisa,
Italy
7
SRON – Netherlands Institute for Space Research,
Sorbonnelaan 2,
3584
CA Utrecht,
The Netherlands
8
Excellence Cluster Universe, Technische Universität München,
Boltzmannstr. 2,
85748
Garching b. München,
Germany
9
European Southern Observatory,
Karl-Schwarzschild-Str. 2,
85748
Garching b. München,
Germany
10
Dip. di Fisica e Astronomia, Alma Mater Studiorum, Università degli Studi di Bologna,
Via P. Gobetti 93/2,
40129
Bologna,
Italy
11
INAF – Osservatorio di Astrofisica e Scienza dello Spazio di Bologna,
Via P. Gobetti 93/3.
40129
Bologna,
Italy
Received:
8
February
2018
Accepted:
24
April
2018
We present the analysis of the restframe optical-to-UV spectrum of APM 08279+5255, a well-known lensed broad absorption line (BAL) quasar at z = 3.911. The spectroscopic data were taken with the optical DOLoRes and near-IR NICS instruments at TNG, and include the previously unexplored range between C III] λ1910 and [O III] λλ4959,5007. We have investigated the possible presence of multiple BALs by computing “balnicity” and absorption indexes (i.e., BI, BI0, and AI) for the transitions Si IV λ1400, C IV λ1549, Al III λ1860, and Mg II λ2800. No clear evidence for the presence of absorption features is found in addition to the already known, prominent BAL associated to C IV, which supports a high-ionization BAL classification for APM 08279+5255. We also studied the properties of the [O III], Hβ, and Mg II emission lines. We find that [O III] is intrinsically weak (F[OIII]∕FHβ ≲ 0.04), as it is typically found in luminous quasars with a strongly blueshifted C IV emission line (~2500 km s−1 for APM 08279+5255). We computed the single-epoch black hole mass based on Mg II and Hβ broad emission lines, finding MBH = (2 ÷ 3) × 1010μ−1 M⊙, with the magnification factor μ that can vary between 4 and 100 according to CO and restframe UV-to-mid-IR imaging respectively. Using a Mg II equivalent width (EW)-to-Eddington ratio relation, the EWMgII ~ 27 Å measured for APM 08279+5255 translates into an Eddington ratio of ~0.4, which is more consistent with μ = 4. This magnification factor also provides a value of MBH that is consistent with recent reverberation-mapping measurements derived from C IV and Si IV.
Key words: galaxies: active / quasars: general / quasars: absorption lines / quasars: emission lines / quasars: supermassive black holes / quasars: individual: APM 08279+5255
The reduced spectrum is only available at the CDS via anonymous ftp to cdsarc.u-strasbg.fr (130.79.128.5) or via http://cdsarc.u-strasbg.fr/viz-bin/qcat?J/A+A/617/A118
© ESO 2018
1 Introduction
APM 08279+5255 is a well-known luminous broad absorption-line quasar (BAL QSO) at z = 3.911. Serendipitously discovered in a Galactic survey for cold carbon stars (Irwin et al. 1998), it is archetypal to several categories of the quasar class, showing together many of the observational phenomena that can be found in such objects. In fact, beyond having evidence of both broad (Srianand & Petitjean 2000) and intrinsic narrow (Ellison et al. 2004) absorption features associated with the C IV λ1549 emission line, it also shows an uncommon O VI λ1030 BAL embedded in the Lyα forest (Hines et al. 1999) and an X-ray ultra-fast outflow (UFO) associated to highly-ionized iron (Hasinger et al. 2002; Chartas et al. 2002; Saez et al. 2009; Hagino et al. 2017). Furthermore, its high-ionization emission lines, from Lyα to C III] λ1910, are characterized by a significant blueshift of ~2500 km s−1 with respectto molecular (Downes et al. 1999) and Balmer lines (Oyabu et al. 2009). A blueshifted emission component with v ~ −800 km s−1, corresponding to a molecular outflow, is also detected in the CO(4 − 3) transition by Feruglio et al. (2017) through 3.2 mm observations with the NOEMA interferometer.
The source APM 08279+5255 is gravitationally lensed (Ledoux et al. 1998) by an unobserved galaxy at z ~ 1 (Petitjean et al. 2000; Ellison et al. 2004). The lensed image is elongated in the NE direction and consists of three components, with a maximum separation of 0″.35 ± 0″.02 (Ledoux et al. 1998). This makes APM 08279+5255 the first confirmed case with an odd number of images (Ibata et al. 1999; Lewis et al. 2002b). The lack of knowledge about the lensing object further complicates the estimation of the magnification factor μ. Current lens models are built on the observation of the CO(1 − 0) molecular line (e.g., Lewis et al. 2002a), but the resulting μ is strongly dependent on the lens geometry, ranging from μ ~ 4 (highly-inclined spiral galaxy; Riechers et al. 2009) up to μ ~ 100 (naked cusp; Egami et al. 2000). Nevertheless, with an intrinsic bolometric luminosity in the range of 5 × 10¹³ to 1015 L⊙ APM 08279+5255 can be considered among the most intrinsically luminous quasars.
Since its discovery, several photometric and spectroscopic observational campaigns have targeted APM 08279+5255 in different energy bands. Both short-term and long-term monitoring of this object have been performed for a wide range of purposes, from the analysis of its optical variability (Lewis et al. 1999) to the study of the UFO through photoionization codes (Saez & Chartas 2011), the investigation of the C IV absorption variability (Trevese et al. 2013; Saturni et al. 2014) and the reverberation mapping (Trevese et al. 2007; Saturni et al. 2016). In particular, the variability study of APM 08279+5255 absorption systems (Trevese et al. 2013; Saturni et al. 2014, 2016) concluded that the C IV absorption variability in APM 08279+5255 is most likely driven by changes in the photoionization state of the gas, responding to variations of the C IV ionizing continuum level.
Single-epoch observations of APM 08279+5255 include restframe UV high-resolution spectroscopy with Keck/HIRES (Ellison et al. 1999) and HST/STIS (Lewis et al. 2002b) for the study of the damped Lyα absorbers (DLAs) and intervening absorption systems (Petitjean et al. 2000; Ellison et al. 2004). Srianand & Petitjean (2000) first analyzed the high-velocity absorption system blueward the C IV emission peak thanks to the availability of the Keck/HIRES spectrum, finding narrow absorption lines embedded between two unresolved broad components. Using the same spectrum, Ellison et al. (2004) studied the resolved absorption feature on the C IV red wing, classifying it as a system of four intervening clouds located close to the quasar systemic redshift.
In this paper, we present the quasi-simultaneous restframe optical-to-ultraviolet (UV) spectrum of APM 08279+5255 taken at the 3.5 m Telescopio Nazionale Galileo (TNG) in La Palma (Canarian Islands) with the Device Optimized for Low Resolution (DOLoRes; λ∕Δλ ~ 700) and the Near-Infrared Spectrograph and Camera (NICS; λ∕Δλ ~ 500). Covering the region between C III] and [O III] λλ4959,5007 which was unobserved so far, this broadband spectrum allows the study of the restframe wavelength range λλ ~ 1000–5000 Å in a single state of quasar activity. In fact, the interval of 76 days between the near-infrared (NIR) and optical observations corresponds to a restframe interval of ~15 days, much shorter than typical variability timescales of APM 08279+5255 (~430 restframe days for continuum flux changes; e.g., Saturni et al. 2016). The paper is organized as follows: we describe the observations and the procedure of data reduction in Sect. 2; we analyze the spectral features in Sect. 3; finally, in Sect. 4 we present single-epoch mass estimates of the supermassive black hole (SMBH) hosted in APM 08279+5255, and discuss our results in Sect. 5. Throughout the text, we report all errors at 1σ confidence level, and adopt a concordance cosmology with H0 = 70 km s−1 Mpc−1, ΩM = 0.3 and ΩΛ = 0.7.
2 Observations and data reduction
Observations of the APM 08279+5255 restframe optical-to-UV spectrum were carried out on 2011 February 19–20 (optical) and 2011 May 05 (UV) at TNG. The restframe UV spectrum of APM 08279+5255 was obtained with the R-band grism (wavelength range λλ4470–10 073 Å, dispersion of2.61 Å px−1, λ∕Δλ = 714) of the DOLoRes instrument, coupled to the 1″ slit. The restframe optical spectrum was acquired with the NICS instrument in two low-resolution configurations, respectively for the IJ (wavelength range λλ9000–14 500 Å, dispersion of5.5 Å px−1, λ∕Δλ = 500) and HK (wavelength range λλ14 000–25 000 Å, dispersion of11.2 Å px−1, λ∕Δλ = 500) bands, with the same slit width of the R-band spectrum.
The restframe UV spectrum λλ1020−1870Å considered in our analysis extends over the observed wavelength interval λλ ~ 5000−9200Å. A large contamination due to overlap of higher spectral orders is visible redward λ ~ 9200Å. The spectrum was calibrated with standard IRAF procedures, and was cleaned from the major telluric absorptions, namely the Fraunhofer A and B bands and the H2 O features, adopting the method described in Trevese et al. (2013). The total restframe optical spectrum extends over the observed wavelength intervals λλ ~ 8700−14 500Å (IJ bands) and λλ ~ 13 500−24 700Å (HK bands), corresponding to λλ1770 5030 Å in the restframe UV-to-optical bands. A standard NICS observing sequence consists of exposures at two different dither positions (A and B) and taken in the pattern ABBA. Background subtraction was obtained performing A−B and B− A image differences, obtaining four positive aperture images. The spectrum was extracted for each differential image in a standard way using the IRAF task apall. Then, in order to remove cosmic rays, the four extracted spectra were combined together. Finally, a telluric standard star was used to correct the target spectrum for the atmospheric transmission.
In producing the joint APM 08279+5255 UV-to-optical spectrum, we compared the restframe UV flux with a coeval spectrum taken in April 2011 at the Asiago observatory (Italy) for a reverberation-mapping campaign of luminous quasars (Trevese et al. 2007, 2014; Saturni et al. 2016). We noted that the TNG UV flux level obtained from standard-star calibration was a factor ~1.1 lower than the Asiago spectrum, which was acquired together with a reference star within a wide (8″) slit in order to do not generate differential light losses and be therefore able to construct meaningful light curves (see e.g., Kaspi et al. 2007, for a discussion). We suspected that a light loss happened in acquiring the TNG/DOLoRes spectrum due to a seeing-limited observation rather than diffraction-limited (seeing at La Palma site of up to ~1″.5, to be compared with the 1″ slit width). Additionally, no IR photometric standard stars were available during the NICS observing night. Therefore, we decided instead to recalibrate the APM 08279+5255 full spectrum to the photometry reported in Egami et al. (2000); Ojha et al. (2009).
First, we matched the spectral sections together by scaling them to the integrated fluxes computed in intervals around two fiducial wavelengths, specifically λ ~ 9200 Å for the match between R and IJ bands and λ ~ 14 400 Å for the match between IJ and HK bands. The matching wavelengths were selected by visual inspection, in order to identify overlapping spectral regions relatively free from fringing and superposition of contiguous spectral orders. The flux-calibrated spectrum was finally obtained by normalizing the joint sections to the corresponding photometry of APM 08279+5255 available in the literature (see Table 1; BV RI magnitudes are from Egami et al. 2000, JHKsL′ magnitudes are from Ojha et al. 2009). To do so, we produced spectro-photometric points by integrating the joint spectrum over the bands listed in Table 1; then, we performed a 1st-order spline fit to the ratios between APM 08279+5255 literature magnitudes and the spectro-photometric points, and obtained the final spectrum by multiplying the joint spectrum by this spline. This approach does not introduce a significant amount of additional uncertainty on the spectral flux level, since the average photometric error Δmph listed in Table 1correspondsto a flux error of ~9 × 10⁻¹⁷ erg s−1 cm−2, which is comparable to the average rms spectrum over the whole wavelength range.
We checked that the magnitudes of APM 08279+5255 used in the recalibration were measured in epochs in which the quasar continuum is not varying. The near-infrared magnitudes are taken at MJD = 51 089 (Egami et al. 2000), whereas the optical photometry is measured in runs between MJD = 53 440 and 54 124 (Ojha et al. 2009). Comparing these epochs with those of the R-band photometricobservations used to construct the light curve of APM 08279+5255 in Trevese et al. (2013) and Saturni et al. (2016, see their Fig. 2), we note that they fall in periods during which the observer-frame optical flux of the quasar remains constant within 0.04 mag. Therefore, our photometry-based spectral recalibration is free of biases introduced by spectral variability.
In order to remove the dust reddening, the spectrum was further de-reddened according to a Small Magellanic Cloud (SMC) extinction law (Pei 1992) with AV = 0.6 (Petitjean et al. 2000) at z = 1.062, i.e., the probable redshift of the lensing galaxy (Ellison et al. 2004). Figure 1 shows the comparison of the joint restframe optical-to-UV spectrum of APM 08279+5255 taken at TNG with a template obtained by matching the Vanden Berk et al. (2001) and the Glikman et al. (2006) SDSS broad-line quasar templates around λ ~ 3000 Å in the restframe, and normalized to match the observed flux at 1350 Å in the restframe. In our procedure, we have not accounted for the intrinsic reddening of the host galaxy (e.g., Gallerani et al. 2010). In general, BAL QSOs appear in fact to be more reddened by intrinsic dust with respect to normal quasars (see e.g., Richards et al. 2003, and refs. therein), with a BAL QSO fraction rising up to ~40% in extremely reddened objects (e.g., Urrutia et al. 2009). However, the comparison of our de-reddened spectrum with the joint quasar template (which is in turn used in the following to compute the indexes of absorption for APM 08279+5255) provides no evidence for intrinsic dust reddening within the host galaxy. We thus prefer to consider only the reddening from the lensing galaxy, although we cannot rule out a possible contribution from the APM 08279+5255 host.
Optical-to-near infrared Vega magnitudes of APM 08279+5255 in the observer frame available in the literature.
3 Analysis of the UV and optical spectral feature
3.1 Absorption features
The restframe UV-to-optical spectrum of APM 08279+5255 is suitable to study the presence of broad absorption features other than those associated to C IV. To this purpose, we calculate the indexes of absorption most commonly used to identify and classify BAL QSOs, namely the “balnicity” index (BI; Weymann et al. 1991), the zero-velocity balnicity index (BI0; Gibson et al. 2009) and the absorption index (AI; Trump et al. 2006). We performed this calculation for both the high- and low-ionization transitions that most frequently produce absorption in this class of objects, that is, Si IV λ1400, C IV λ1549, Al III λ1860, and Mg II λ2800.
The mathematical expression of the BI, BI0 and AI can be generalized into an integral quantity I(k), where k = (k1→5) represents a set of parameters that define the integration limits, the minimal depth and the minimal velocity width of the absorption. We call I(k) the generalized index of absorption, and define it as follows:
![\begin{equation*}I\left( \mathbf{k} \right) = -\int_{-3000 k_1}^{-(25 + 4 k_2)\times 1000}\left[ 1-\frac{f(v)}{0.1 k_3} \right]C\left( k_4, k_5 \right) {\rm{d}}v\mbox{,} \end{equation*}](/articles/aa/full_html/2018/09/aa32794-18/aa32794-18-eq1.png) (1)
(1)
where f(v) is the normalized QSO flux in the velocity space, and C(k4, k5) a constant assuming unitary value over absorbed regions in which the integrand function is positive, provided that the integrand itself remains greater than 0.1k4 in contiguous portions of the absorption trough at least 1000k5 km s−1 wide (otherwise, C = 0). Within this scheme, the set k uniquely identifies each index of absorption: kBI = (1, 0, 9, 0, 2), kBI_0 = (0, 0, 9, 3, 2), and kAI = (0, 1, 10, 1, 1). To compute these indexes, we normalize the dereddened APM 08279+5255 spectrum to the joint quasar template from Vanden Berk et al. (2001) and Glikman et al. (2006) shown in Fig. 1, then evaluating the BI, BI0, and AI according to Eq. (1).
The formal error  associated to I(k) is connected to the rms error on the flux σf(v) by
![\begin{equation*}\sigma^2_I\left( \mathbf{k} \right) = -\int_{-3000 k_1}^{-(25 + 4 k_2)\times 1000}\left[ \frac{\sigma_f(v)}{0.1 k_3} \right]^2 C\left( k_4, k_5 \right) {\rm{d}}v, \end{equation*}](/articles/aa/full_html/2018/09/aa32794-18/aa32794-18-eq3.png) (2)
(2)
although the real uncertainty is usually dominated by systematics in the continuum placement (Trump et al. 2006). Therefore, we adopt a Monte Carlo simulative approach to give a proper evaluation of the uncertainties associated to each nonzero index, or provide fiducial upper limits. Accordingly, we alter the spectrum by adding random noise with Poissonian distribution to each spectral bin, which is assumed to be the mean value of the noise distribution at its wavelength. We then recompute I(k) on this altered spectrum, iterating theprocess 103 times to reach statistical significance. Finally, we take the standard deviation of the I(k) posterior distribution as the uncertainty to be associated to a nonzero index on the true spectrum. In case of null indexes, we set this standard deviation as the upper limit on the absorption strength. This procedure succeeds in producing fiducial uncertainties or upper limits for all the indexes of absorption but the BI0 for Si IV, Al III, and Mg II. This can be explained in terms of the conservative definition of BI0 given by Gibson et al. (2009), which requires deep absorption features to produce a positive value of this index.
Figure 2 shows the normalized spectral regions around Si IV, C IV, Al III, and Mg II. The values of BI, BI0, and AI for each transition are listed in Table 2, along with the associated uncertainty. We consider significant only absorption detected at a confidence level >3σ. The only absorption feature that satisfies this criterion is the known BAL associated to C IV. However, when observed at high resolution, this absorption structure reveals to be not a single trough, but rather a complex system with two true C IV BALs at v ~ −9750 and ~ −4500 km s−1 separated by narrow absorptions located around v ~ −8500 km s−1 (Srianand &Petitjean 2000). Variability studies suggest that this narrow-absorption complex is nevertheless associated with C IV outflows, since it shows a variability pattern very similar to the C IV BAL (see e.g., Fig. 6 of Trevese et al. 2013). In this case the integral in Eq. (1) is calculated across the whole spectral range λλ1400 − 1550, hence including all the features and giving values in agreement with those obtained by Trevese et al. (2013) for the equivalent width (EW) of the total absorption (from ~2300 to ~4800 km s−1). In addition, the upper limits to the Si IV absorption strength reflect the sampling of the multiple narrow absorption identified by Ellison et al. (2004) as intervening C IV, Si IV, and Mg II features (EW between ~90 and ~140 km s−1; see their Table 2 and Fig. 2). With respect to the low-ionization transitions, the Al III spectral region is affected by fringing in the 8300−9000 Å range that artificially increases the flux level with respect to the reference quasar template, thus preventing a reliable estimate of the Al III absorption strength. The low-significance Mg II feature, composed by two troughs respectively at v ~ 0 (not sampled by the BI) and ~ −2 × 10⁴ km s−1, is between approximately ten and twenty times weaker than the C IV BAL when the AI or BI are used. Furthermore, any firm conclusion about the presence of Mg II BALs is prevented by the low-sensitivity gap between the bands J and H. Therefore, we classify APM 08279+5255 as a high-ionization BAL QSO (HiBAL) due to the lack of unambiguous low-ionization absorption features.
The most common class of BAL QSOs (~85% of the BAL QSO population; e.g., Farrah et al. 2007) is that of the HiBALs. In particular, BALs associated with C IV represent the most common absorption troughs found in quasars, and are widely used to study the evolution of the BAL QSO population with cosmic time (Hewett & Foltz 2003; Reichard et al. 2003; Knigge et al. 2008; Gibson et al. 2009; Allen et al. 2011) as well as to characterize the ensemble absorption variability timescales (Barlow 1993; Lundgren et al. 2007; Gibson et al. 2008, 2010; Capellupo et al. 2011, 2012, 2013; Filiz Ak et al. 2014). For instance, the time variability of the APM 08279+5255 C IV BAL has been studied in detail in Trevese et al. (2013) and Saturni et al. (2014, 2016), spanning a time interval of ~19 yr in the observer frame (i.e., ~3.9 yr in the restframe). The discovery of significant low-ionization troughs would have been extremely interesting to, for example, unveil a possible transition between an obscured AGN phase and a normal quasar, as suggested by Farrah et al. (2007, 2012) for the case of ultraluminous IR galaxies (ULIRGs) such as APM 08279+5255 (Rowan-Robinson 2000). Nevertheless, the simultaneous presence of an UFO, a BAL and a molecular outflow in its spectrum makes APM 08279+5255 similar to the local quasar and ULIRG Mrk 231 (Feruglio et al. 2015), configuring this object as one of the best potential targets to investigate multiphase outflows at higher redshifts and extreme energetic regimes (see e.g., Cicone et al. 2018).
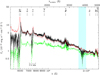 |
Fig. 1 Calibrated spectrum of APM 08279+5255 before (green dashed line) and after dereddening (black solid line), with corresponding 1σ uncertainty (gray band) – see Sect. 2. Superimposed to the data, the composite quasar template obtained by matching the Vanden Berk et al. (2001) and Glikman et al. (2006) templates around λ ~ 3000 Å in the restframe (red line) is shown. The continuum level is marked as a black dotted line with slope − 1.54. A residual telluric absorption is still present between λ ~ 17 500 Å and 20 000 Å (cyan shaded area), hence this spectral interval is excluded from the present analysis. |
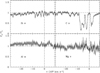 |
Fig. 2 Flux of APM 08279+5255 normalized to the Vanden Berk et al. (2001) and Glikman et al. (2006) joint quasar template. The spectral regions around the Si IV emission (top left panel), the C IV emission (top right panel), the Al III emission (bottom left panel) and the Mg II emission (bottom right panel) are shown. In all panels, the velocity scale is relative to the systemic redshift z = 3.911 derived fromthe CO(4 − 3) and CO(9 − 8) emission lines (Downes et al. 1999). As a guidance, the zero-velocity position (dot-dashed line) and the normalized flux level (dashed line) are indicated. |
APM 08279+5255 indexes of absorptionassociated to the main BAL transitions in quasars.
3.2 Mg II, Hβ, and [O III] emission lines
In order to study the properties of the Mg II, Hβ, and [O III] emission lines of APM 08279+5255, we performed a spectral analysis of the two regions corresponding to the Hβ+[O III] (restframe wavelength range ~3990–5040 Å, which also includes the Hγ λ4340 emission) and Mg II (restframe wavelength range ~2200–3500 Å). The analysis was done by using custom IDL processing scripts, based on the IDL package MPFIT (Markwardt 2009). The emission lines and the continuum emission were fitted together, by minimizing the χ2. Figure 3 shows a magnification out of such spectral regions, which are characterized by strong Fe II emission producing a complex pseudo-continuum close to Hβ and Mg II.
As a first step, we tried to account for this Fe II-related emission in the restframe optical range by including the typical observational Fe II templates from Boroson & Green (1992), Véron-Cetty et al. (2004) and Tsuzuki et al. (2006) in the fits. We also considered the library of CLOUDY Fe II synthetic spectral templates presented in Bischetti et al. (2017) for hyper-luminous Type I quasars. In the fit, each template was convolved with a Gaussian whose width was free to vary, in order to account for the velocity dispersion of the gas. However, none of these templates was able to reproduce the Fe II spectral features observed in APM 08279+5255. Furthermore, we also found that the observational Fe II template from Vestergaard & Wilkes (2001) fails to reproduce the Fe II emission in the spectral region around Mg II. This failure might be partly due to the presence of telluric features in the near-IR spectra limiting the spectral windows used to anchor the fit. However, it is more likely that APM 08279+5255, being an exceptional object, shows an intrinsic difference in the Fe II emission properties, as the relative intensities of the main Fe II emission blends do not match any template from the adopted library. Furthermore, we also tried to simultaneously fit two different Fe II templates with independent velocity dispersion, as done in Vietri et al. (2018) in case of hyper-luminous quasars similar to APM 08279+5255 with strong Fe II emission. However, this did not result in an improvement. Therefore, we fitted the most prominent Fe II features in the spectrum by means of multiple Gaussian components. We tried to limit the dependence of the resulting line parameters on the adopted model by using a minimum number of Fe II components: in other words, we checked that adding another Gaussian component did not lead to a significant improve of the χ2. However, a modest degeneracy between subtle Fe II emission and the other emission lines might still be present.
The spectral fitting procedure in the Hβ+[O III] range is particularly challenging due to the combination of (i) a limited spectral coverage redward 5007 Å, (ii) the fact that these lines fall very close to the edge of the NICS wavelength coverage, which is affected by telluric absorption, and (iii) the lack of a clear emission feature at the wavelengths expected for the [O III] doublet. We thus tested two spectral models in order to infer the properties of any subtle [O III] emission. The first model (model A hereafter) only considers the presence of Fe II emission redward the Hβ emission, while the second model (model B) accounts for the presence of both [O III] and Fe II in this spectral region. Specifically, model A includes a Gaussian component with FWHM free to vary in order to account for the Fe II emission at 4861 < λ < 5000 Å in the restframe; the upper bound was set taking into account the NICS spectral resolution of ~40 Å at these wavelengths in order to not overlap with spectral regions involving possible [O III] emission at 5007 Å.
Model B is similar to model A, but also includes two Gaussian components to fit the [O III] λλ4959,5007 Å doublet with a fixed FWHM = 1000 km s−1, which is a typical upper limit to the width of emission lines associated to the narrow-line region. The centroids of the [O III] doublet components were fixed to 5007 Å and 4959 Å in the restframe, and the ratio of their normalizations was fixed at 1:3. Furthermore, both models include n total four Gaussian components to fit the Hβ and Hγ broad emissions, the strong Fe II emission features centered at ~4050 Å and ~4550 Å, and a power law to parameterize the continuum emission. Apart from the [O III] doublet, the velocity offset between all Gaussian components are free to vary. Both models are shown in Fig. 3b.
The restframe main spectral parameters, derived from the different models applied to the NICS data, are shown in Table 3. The Hβ emission is well reproduced by a broad Gaussian profile, with a FWHMHβ ~ 7000−7400 km s−1, that appears to be slightly redshifted (λHβ ~ 4868 Å, i.e., ~410 km s−1) with respect to the systemic redshift z = 3.911 inferred from CO lines (Downes et al. 1999); however, given the dispersion error of ~8 Å in the restframe associated to the grism, the position of the Hβ emission peak is still consistent with the assumed systemic redshift. The addition of the [O III]-related components in model B yields a decrease of Δχ2 = 12 for one additional free parameter (i.e., the [O III] λ5007 Å normalization) compared to model A, which represents a statistical improvement at 98.7% confidence level according to an F-test. This suggests that a weak [O III] emission with F[OIII](5007 Å) = (1.8 ± 0.7) × 10−15 erg s−1 cm−2, corresponding to an [O III]-to-Hβ flux ratio F[OIII]∕FHβ = 0.04, can still be present in the optical spectrum of APM 08279+5255. Such an [O III] weakness is consistent with the detection of strong Fe II emission, according to Eigenvector 1 (e.g., Boroson & Green 1992; Shen & Ho 2014). However, we stress that any firm conclusion on the properties of [O III] emission in APM 08279+5255 is hamperedby the low S/N and limited spectral coverage of the NICS data.
As for the fit to the spectral data in the Mg II emission region, we used a model consisting of one Gaussian component that accounts forthe Mg II line, four Gaussian components to fit the main Fe II emission features centered respectively at ~2300 Å, ~2450 Å, ~2550 Å and ~3200 Å in the restframe, and a power law for the underlying continuum (see Fig. 3a). Such a fit yields a good description of the spectrum with an associated reduced χ2 = 1.45. The best-fit value for the FWHM of the Mg II broad emission line is  km s−1. Remarkably, we found that the Mg II emission centroid is located at λMg II ~ 2789 Åblueshifted by 11 Å (1180 ± 430 km s−1) with respectto the expected value at the systemic redshift. This blueshift is a factor of approximately two larger than the restframe dispersion error associated to the grism resolution in this spectral range, and is also approximately two times smaller than the blueshift of 2500 ± 40 km s−1 measured for the C IV emission (and valid for other high-ionization emission lines such as N V, Si IV and C III]; e.g., Irwin et al. 1998) from the R-band spectrum taken with the high-resolution spectrograph STIS on board of HST (Lewis et al. 2002b). We show this blueshift dependence on wavelength in Fig. 4, where the centroid shifts measured for C IV, Mg II, and Hβ broad emission lines are compared. This figure highlights that the Mg II emission line can be affected by a strong blueshift in the same way as high-ionization features. This can therefore bias the single-epoch SMBH mass estimate based on this low-ionization transition in case of highly-accreting AGN (e.g., Marziani et al. 2013). In particular, Mg II is extensively used to measure the SMBH mass of high-luminosity quasars at z > 5, due to the fact that Hβ line is no longer observable in the K band.
Previous studies found the [O III] weakness to be associated with broad blueshifted C IV emission in samples of Type 1 luminous quasars (e.g., Netzer et al. 2004). In their study of the optical-to-UV spectra of WISE/SDSS selected hyper-luminous quasars (WISSH; e.g., Bischetti et al. 2017), Vietri et al. (2018) have indeed found that ~70% of them exhibit very weak [O III] emission (<5 Å) and largelyblueshifted (≈2000−8000 km s−1) C IV emission with restframe EWs ≲ 20 Å. They interpreted these properties in terms of a steep UV-to-X-ray continuum in luminous quasars coupled to a face-on view of the continuum source. The former property leads to an efficient line-driving acceleration mechanism for broad-line region (BLR) winds (Proga & Kallman 2004; Wu et al. 2009; Risaliti & Elvis 2010; Richards et al. 2011), while the latter implies an observed small EW of the [O III] emission line (see Bisogni et al. 2017). The reconstruction of the C IV line profile on the APM 08279+5255 HST/STIS spectrum made by Saturni et al. (2016) allows us to compute a C IV restframe EW of 24 ± 2 Å. This value is in agreement with the C IV EWs commonly measured in other very luminous quasars with weak [O III] and large C IVblueshift.
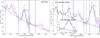 |
Fig. 3 NICS spectrum of APM 08279+5255 corresponding to the Mg II and Hβ+[O III] spectral regions. Specifically, panel a shows the best fit description of the restframe ~ 2200−3400 Å band. Panel b and its inset show the best-fit description of the restframe ~ 3990−5040 Å band according to models A and B, respectively. In all panels, a purple solid line marks the power-law quasar continuum. Blue dashed curves refer to Mg II, Hγ, and Hβ emission lines, whereas the Fe II emission is plotted as magenta dot-dashed lines. In model B, the green curve refers to the [O III] emission. Gray bands indicate the regions excluded from the fit because of the presence of telluric features. |
Spectral fit results derived for the Hβ+[O III] and Mg II regions of APM 08279+5255.
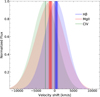 |
Fig. 4 Velocity shifts of the Hβ (blue), Mg II (red) and C IV (green) lines with respect to z = 3.911. The centroids of the best fit Gaussian profiles resulting from our analysis (Hβ and Mg II) and Saturni et al. (2016, C IV, based on high-resolution HST/STIS data) are indicated by vertical lines with the corresponding uncertainties (shaded vertical bands). |
4 Single-epoch black hole mass estimates
The TNG observations of APM 08279+5255 allow us to provide the virial single-epoch black hole mass MBH using Mg II and Hβ emission lines. These lines are much more reliable proxies of the BLR dynamics than C IV, whose profile is potentially affected by nonvirial motion of the emitting gas (Baskin & Laor 2005; Shen & Liu 2012; Vietri et al. 2018). Furthermore, in the case of APM 08279+5255 the presenceof strong BAL systems introduces additional uncertainty in the fit of the intrinsic C IV line profile. A direct measurement of MBH based on C IV and Si IV reverberation mapping (RM; e.g., Peterson 1997) was provided by Saturni et al. (2016), who analyzed the HST/STIS spectrum. They were, therefore, able to accurately recover the C IV emission profile without the contamination of telluric features associated to the Fraunhofer A band on the red wing of the line, deriving a FWHM of 7480 ± 70 km s−1 and, in turn, a  . The same RM-based value1 of MBH was also obtained for the Si IV line, strengthening an estimate that could be affected by nonvirial components as in the case of C IV.
In our calculations, we have adopted the single-epoch relations derived by Bongiorno et al. (2014) for Mg II and Hβ, using the FWHMs and reddening-corrected monochromatic luminosities listed in Table 3. These relations can be expressed in the form:
![\begin{equation*}\log{\left( \frac{M_{\textrm{BH}}}{{M}_{\odot}} \right)} = a + 0.5\log{\left[ \frac{\lambda L_{\lambda}\left( \textrm{3000~\AA}/\textrm{5100~\AA} \right)}{10^{44}\mbox{ erg s}^{-1}} \right]} + 2\log{\left( \frac{\textrm{FWHM}_{\textrm{MgII/H}\beta}}{1000\mbox{ km s}^{-1}} \right)}, \end{equation*}](/articles/aa/full_html/2018/09/aa32794-18/aa32794-18-eq6.png) (3)
(3)
with the parameter a = 6.6 for Mg II and 6.7 for Hβ respectively. In addition to the estimates of MBH based on the Hβ and Mg II from the TNG spectrum, we also derive an additional one based on C IV. We use the Gaussian fit to the C IVemission from the HST/STIS spectrum performed by Saturni et al. (2016) and adopt the single-epoch relation from Vestergaard & Peterson (2006) corrected according to the prescription on the line blueshift ΔvCIV for high-luminosity quasars (Coatman et al. 2017). This correction yields:
![\begin{eqnarray*}\log{\left( \frac{M_{\textrm{BH}}}{{M}_{\odot}} \right)} &=& 6.71 + 0.53 \log{\left[ \frac{\lambda L_{\lambda}\left( \textrm{1350~\AA} \right)}{10^{44}\mbox{ erg s}^{-1}} \right]}\nonumber\\ && + 2 \log{\left( \frac{\textrm{FWHM}_{\textrm{CIV}}}{1000\mbox{ km s}^{-1}} \right)} \nonumber\\ &&- 2 \log{\left[ \alpha \left( \frac{{\rm{\Delta}} v_{\textrm{CIV}}}{1000\mbox{ km s}^{-1}} \right) + \beta \right]}, \end{eqnarray*}](/articles/aa/full_html/2018/09/aa32794-18/aa32794-18-eq7.png) (4)
(4)
with α ≈ 0.4 and β ≈ 0.6.
Table 4 shows the estimates of the MBH of APM 08279+5255 based on the different transitions. Due to the fact that APM 08279+5255 is lensed by a foreground system which remains unobserved, at least two competing lens models have been proposed to explain the lack of a lens image. Egami et al. (2000) proposed a naked-cusp configuration in which the magnification at UV-to-optical wavelengths can rise up to ~100. Riechers et al. (2009) derived their lens model from the analysis of the CO emission region, finding a lower, almost achromatic magnification of approximately four. Accordingly, Table 4 lists the SMBH mass estimates as a function of different values of the magnification parameter: μ = 1 (i.e., no magnification), 4 and 100 respectively. The error associated to MBH includes in quadrature both the statistical uncertainties and intrinsic scatter in the single-epoch relations of ~0.26 dex (Vestergaard & Peterson 2006; Shen et al. 2011; Bongiorno et al. 2014). Even in the most conservative case of μ = 100, the MBH derived by considering the Hβ emission line is >109 M⊙, which indicates that APM 08279+5255 harbors a SMBH at the heaviest end of the MBH distribution.
In Table 4 we also report the estimate of the Eddington ratios λEdd = Lbol∕LEdd based on these MBH values, assuming a bolometric luminosity Lbol = 2.7 × 1048 erg s−1 before correcting for μ =4 and 100 (which correspond to a true bolometric luminosity of 6.8 × 1047 erg s−1 and 2.7 × 1046 erg s−1 respectively). We derive such a luminosity from the lensed monochromatic luminosity at 3000 Å adopting the bolometric correction with nonzero intercept by Runnoe et al. (2012a,b):
![\begin{equation*}L_{\textrm{bol}}= 0.75 \left[10^{1.852} \cdot \lambda L_{\lambda}(3000\mbox{ }\AA)^{0.975}\right] \end{equation*}](/articles/aa/full_html/2018/09/aa32794-18/aa32794-18-eq8.png) (5)
(5)
We consider this estimate of Lbol as our fiducial value instead of deriving such a quantity from the fit of APM 08279+5255 spectral energy distribution (SED), since we note that the SED itself is affected by a wavelenght-dependent magnification factor resulting from the contribution of emitting regions of different size. In this way, we are also consistent with the UV-to-optical luminosities used to evaluate the single-epoch SMBH mass of APM 08279+5255.
Dong et al. (2009) reported the existence of a strong correlation between the EW of Mg II and λEdd, i.e.,  . Such an effect is possibly due to a decrease in the covering factor of the Mg II BLR at increasing λEdd (i.e., the number of Mg II emitting clouds decreases due to radiation-pressure blowing; see also Fabian et al. 2006; Marconi et al. 2008, 2009). We used this relation to obtain an independent estimate of λEdd for APM 08279+5255. The restframe EW derived from the TNG spectrum is EW_Mg II = 27.1 ± 1.5 Å, which corresponds to
  taking into account the scatter of 0.38 dex in λEdd in the Dong et al. (2009) data. We note that the confidence interval of λEdd obtained in this way is fully consistent with the values listed in Table 4 for the case of μ = 4, and only marginally consistent for the case of μ = 100. This suggests that a moderate lens magnification μ < 100 for APM 08279+5255 can be favored over a more extreme value.
We can then derive an independent estimate of μ using the λEdd obtained from the Dong et al. (2009) relation. In fact, from Eq. (3) we derive that λEdd ∝ μ1−b, and hence
![\begin{equation*}\mu = \left[ \frac{\lambda_{\textrm{Edd}}^{\textrm{(obs)}}}{\lambda_{\textrm{Edd}}^{\textrm{(true)}}} \right]^{\frac{1}{1 - b}}, \end{equation*}](/articles/aa/full_html/2018/09/aa32794-18/aa32794-18-eq11.png) (6)
(6)
where b is the coefficient multiplying  in Eqs. (3) and (4) (0.5 for Hβ and Mg II from Bongiorno et al. 2014, and 0.53 for C IV from Vestergaard & Peterson 2006). Therefore, a
  corresponds to 4.1 ≲ μ ≲ 9.3 (and, in turn, a bolometricluminosity 2.9 × 1047 ≲ Lbol ≲ 6.7 × 1047 erg s−1 and a black hole mass 6.5 × 10⁹ ≲ MBH ≲ 1.5 × 10¹⁰ M⊙) using as
  the values listed in the first column of Table 4 (i.e., the case of no magnification). Such an intermediate magnification factor is also in agreement with the upper limit of μ ≲ 8.2 derived by Saturni et al. (2016) from the RM. We also note that a lower limit on APM 08279+5255 black hole mass MBH ≳ 4 × 10⁹ M⊙ has been derived by Hagino et al. (2017) through SED modeling. Using our fiducial luminosity and FWHM measurements for Mg II in Eq. (3) (see Table 3), we find that this limit is respected for μ ≲ 50.
SMBH mass and Eddington ratio of APM 08279+5255 derived from Hβ, Mg II and C IV broad emission lines, as a function of the magnification parameter μ.
5 Summary and conclusions
In this work, we have presented the quasi-simultaneous UV-to-optical spectrum of APM 08279+5255 taken at TNG with the instruments DOLoRes and NICS. The presence of a UFO, a BAL and a molecular outflow in this object is of great interest to explore the properties of multiphase quasar winds at high redshifts and extreme luminosities with dedicated multiwavelength observations, in order to probe the possible presence of ongoing AGN feedback. This spectrum covers the previously unobserved region between C III] and [O III], thus providing important constraints on the BAL classification, the SMBH mass, the Eddington ratio and the magnification factor in this high-z quasar. Our main results can be summarized as follows:
We tested the balnicity of APM 08279+5255 for high- and low-ionization transitions. We computed the most commonly used indexes (BI, BI0, and AI) of absorption for Si IV, C IV, Al III, and Mg II, confirming the BAL only for C IV and hence supporting a HiBAL rather than a LoBAL classification for APM 08279+5255.
The near-infrared NICS spectrum has allowed us, for the first time, to study the spectral regions corresponding to the Hβ+[O III] and Mg II emission lines in APM 08279+5255. The Hβ line profile shows a FWHM of ~7400 km s−1 and a centroid consistent with the CO-based systemic redshift z = 3.911. Conversely, the Mg II emission line (FWHM ~ 9200 km s−1) is characterized by a blueshift of ~1200 km s−1, lower by a factor of approximately two than the blueshift of ~2500 km s−1 measured for the C IV emission line. This result is in agreement with previous works that find larger blueshifts in high-ionization transitions (Richards et al. 2002; Baskin & Laor 2005).
We also investigated the presence of [O III] λλ4959,5007 Å emission in a spectral region very close to the red edge of the NICS spectrum and characterized by strong Fe II emission. Our best-fit model includes a low-significance [O III] component with F[OIII](5007 Å) ~ (1.8 ± 0.7) × 10−15 erg s−1 cm−2. This indicates that the [O III] emission in APM 08279+5255 is intrinsically weak with F[OIII]∕FHβ = 0.04, consistent with the prediction of Eigenvector 1 (Boroson & Green 1992) of an anti-correlation between Fe II and [O III] emission. APM 08279+5255 therefore shares the properties of the [O III] and C IV emission lines observed in other sources lying at the bright end of the AGN luminosity function (Richards et al. 2011; Shen & Ho 2014; Zuo et al. 2015; Marziani et al. 2016; Shen 2016; Vietri et al. 2018).
We have been able to derive for the first time estimates of the MBH in APM 08279+5255 based on the Hβ and Mg II emission lines. These transitions have been found to provide a much more reliable measurement of MBH in AGN than C IV. This is even more true in the case of APM 08279+5255, whose C IV emission line is affected by BAL features. We find very large mass values (logMBH∕M⊙≳ 9.3) for a magnification factor μ varying from 1 (i.e., no magnification) to 100 (Egami et al. 2000). A value of μ = 4 (Riechers et al. 2009) is compatible with the RM-based MBH estimate of logMBH∕M⊙~ 10 given in Saturni et al. (2016). The EWMg II-based estimate of λEdd according to the EW − λEdd relation by Dong et al. (2009) also suggests a moderate magnification factor 4.1 ≲ μ ≲ 9.3, corresponding to an intrinsic bolometric luminosity 2.9 × 1047 ≲ Lbol ≲ 6.7 × 1047 erg s−1 and a black hole mass 6.5 × 10⁹ ≲ MBH ≲ 1.5 × 10¹⁰ M⊙). This is in turn compatible with both the upper limit μ ≲ 8.2 found by Saturni et al. (2016) with RM, and the limit μ ≲ 50 derived from the single-epoch relations by adopting the minimal black hole mass MBH = 4 × 10⁹ M⊙ inferred by Hagino et al. (2017) through APM 08279+5255 SED modeling.
Being taken 76 days apart (corresponding to only ~15 restframe days), the UV and optical spectral sections of APM 08279+5255 probe the same AGN state. This allowed us to study its physical properties consistently during a state of relatively constant AGN emission. Indeed, this source has been found to vary in continuum, emission- and absorption-line intensity, with flux changes of up to ~0.5 mag (Trevese et al. 2013; Saturni et al. 2016). Therefore, multiband spectroscopic observations of APM 08279+5255 must be quasi-simultaneous in order to overcome the lack of a common reference for a compatible flux calibration between spectra taken at different epochs. The possibility to observe APM 08279+5255 with the forthcoming James Webb Space Telescope (JWST) is hence of extreme interest, since the spectro-photometric capabilities of its instruments, simultaneously covering the wavelength range λλ6000 − 2.8 × 10⁵ Å (Dorner et al. 2016; Labiano et al. 2016), may allow for this source the detailed study of the stratified BLR dynamics around its central black hole and the characterization of the outflows associated to emission features from Si IV to molecular lines.
Finally, we note that the estimates of μ and λEdd presented in this work are based on the comparison of the SE measurements of MBH with the direct SMBH mass measurement by Saturni et al. (2016), which relies, in turn, on the reverberation mapping of the high-ionization C IV and Si IV lines that are affected by narrow (intrinsic or intervening) and broad absorption. Such absorption may bias the determination of MBH, and this bias is difficult to quantify. Future observations aimed at directly measuring APM 08279+5255 MBH with novel techniques, such as BLR spectroastrometry, are therefore needed. In particular, the spectroastrometric technique presented in Stern et al. (2015) may potentially allow to spatially resolve the kinematics of broad-line regions with single spectroscopic observations taken at high signal-to-noise ratio (S∕N ≳ 40) in adaptive optics (AO) regime. Such capabilities are already at reach of current-generation telescopes such as the Large Binocular Telescope (LBT). Therefore, the AO infrared spectroscopy of APM 08279+5255 is a primary task to place better constraints on its SMBH mass and thus to obtain a more robust evaluation of lens magnification and accretion properties.
Acknowledgements
We thank our anonymous referee for their helpful comments. We acknowledge R. Maiolino (Kavli Institute for Cosmology) and D. Trevese (“Sapienza” University of Rome) for useful discussion. This research is based on observations made with the Italian Telescopio Nazionale Galileo (TNG) operated on the island of La Palma by the Fundación Galileo Galilei of the INAF (Istituto Nazionale di Astrofisica) at the Spanish Observatorio del Roque de los Muchachos of the Instituto de Astrofísica de Canarias. IRAF is distributed by the National Optical Astronomy Observatories, which are operated by the Association of the Universitiesfor Research in Astronomy, Inc., under cooperative agreement with the National Science Foundation. CC and CF acknowledge funding from the European Union’s Horizon 2020 Research and Innovation Programme under the Marie Sklodowska-Curie grant agreement No. 664931. GV acknowledges funding support from the DFG Cluster of Excellence “Origin and Structure of the Universe” (www.universe-cluster.de).
References
- Allen, J. T., Hewett, P. C., Maddox, N., Richards, G. T., & Belokurov, V. 2011, MNRAS, 410, 860 [NASA ADS] [CrossRef] [Google Scholar]
- Barlow, T. A. 1993, PhD Thesis, California University, USA [Google Scholar]
- Baskin, A., & Laor, A. 2005, MNRAS, 356, 1029 [NASA ADS] [CrossRef] [Google Scholar]
- Bischetti, M., Piconcelli, E., Vietri, G., et al. 2017, A&A, 598, A122 [NASA ADS] [CrossRef] [EDP Sciences] [Google Scholar]
- Bisogni, S., Marconi, A., & Risaliti, G. 2017, MNRAS, 464, 385 [NASA ADS] [CrossRef] [Google Scholar]
- Bongiorno, A., Maiolino, R., Brusa, M., et al. 2014, MNRAS, 443, 2077 [NASA ADS] [CrossRef] [Google Scholar]
- Boroson, T. A., & Green, R. F. 1992, ApJS, 80, 109 [NASA ADS] [CrossRef] [Google Scholar]
- Capellupo, D. M., Hamann, F., Shields, J. C., Rodríguez Hidalgo, P., & Barlow, T. A. 2011, MNRAS, 413, 908 [NASA ADS] [CrossRef] [Google Scholar]
- Capellupo, D. M., Hamann, F., Shields, J. C., Rodríguez Hidalgo, P., & Barlow, T. A. 2012, MNRAS, 422, 3249 [NASA ADS] [CrossRef] [Google Scholar]
- Capellupo, D. M., Hamann, F., Shields, J. C., Halpern, J. P., & Barlow, T. A. 2013, MNRAS, 429, 1872 [NASA ADS] [CrossRef] [Google Scholar]
- Chartas, G., Brandt, W. N., Gallagher, S. C., & Garmire, G. P. 2002, ApJ, 579, 169 [NASA ADS] [CrossRef] [Google Scholar]
- Cicone, C., Brusa, M., Ramos Almeida, C., et al. 2018, Nat. Astron., 2, 176 [Google Scholar]
- Coatman, L., Hewett, P. C., Banerji, M., et al. 2017, MNRAS, 465, 2120 [NASA ADS] [CrossRef] [Google Scholar]
- Dong, X.-B., Wang, T.-G., Wang, J.-G., et al. 2009, ApJ, 703, L1 [NASA ADS] [CrossRef] [Google Scholar]
- Dorner, B., Giardino, G., Ferruit, P., et al. 2016, A&A, 592, A113 [NASA ADS] [CrossRef] [EDP Sciences] [Google Scholar]
- Downes, D., Neri, R., Wiklind, T., Wilner, D. J., & Shaver, P. A. 1999, ApJ, 513, L1 [NASA ADS] [CrossRef] [Google Scholar]
- Egami, E., Neugebauer, G., Soifer, B. T., et al. 2000, ApJ, 535, 561 [NASA ADS] [CrossRef] [Google Scholar]
- Ellison, S. L., Lewis, G. F., Pettini, M., et al. 1999, PASP, 111, 946 [NASA ADS] [CrossRef] [Google Scholar]
- Ellison, S. L., Ibata, R., Pettini, M., et al. 2004, A&A, 414, 79 [NASA ADS] [CrossRef] [EDP Sciences] [Google Scholar]
- Fabian, A. C., Celotti, A., & Erlund, M. C. 2006, MNRAS, 373, L16 [NASA ADS] [Google Scholar]
- Farrah, D., Lacy, M., Priddey, R., Borys, C., & Afonso, J. 2007, ApJ, 662, L59 [NASA ADS] [CrossRef] [Google Scholar]
- Farrah, D., Urrutia, T., Lacy, M., et al. 2012, ApJ, 745, 178 [NASA ADS] [CrossRef] [Google Scholar]
- Feruglio, C., Fiore, F., Carniani, S., et al. 2015, A&A, 583, A99 [NASA ADS] [CrossRef] [EDP Sciences] [Google Scholar]
- Feruglio, C., Ferrara, A., Bischetti, M., et al. 2017, A&A, 608, A30 [NASA ADS] [CrossRef] [EDP Sciences] [Google Scholar]
- Filiz Ak, N., Brandt, W. N., Hall, P. B., et al. 2014, ApJ, 791, 88 [NASA ADS] [CrossRef] [Google Scholar]
- Gallerani, S., Maiolino, R., Juarez, Y., et al. 2010, A&A, 523, A85 [NASA ADS] [CrossRef] [EDP Sciences] [Google Scholar]
- Gibson, R. R., Brandt, W. N., Schneider, D. P., & Gallagher, S. C. 2008, ApJ, 675, 985 [NASA ADS] [CrossRef] [Google Scholar]
- Gibson, R. R., Jiang, L., Brandt, W. N., et al. 2009, ApJ, 692, 758 [NASA ADS] [CrossRef] [Google Scholar]
- Gibson, R. R., Brandt, W. N., Gallagher, S. C., Hewett, P. C., & Schneider, D. P. 2010, ApJ, 713, 220 [NASA ADS] [CrossRef] [Google Scholar]
- Glikman, E., Helfand, D. J., & White, R. L. 2006, ApJ, 640, 579 [NASA ADS] [CrossRef] [Google Scholar]
- Graham, A. W., Onken, C. A., Athanassoula, E., & Combes, F. 2011, MNRAS, 412, 2211 [NASA ADS] [CrossRef] [Google Scholar]
- Grier, C. J., Martini, P., Watson, L. C., et al. 2013, ApJ, 773, 90 [CrossRef] [Google Scholar]
- Hagino, K., Done, C., Odaka, H., Watanabe, S., & Takahashi, T. 2017, MNRAS, 468, 1442 [NASA ADS] [CrossRef] [Google Scholar]
- Hasinger, G., Schartel, N., & Komossa, S. 2002, ApJ, 573, L77 [NASA ADS] [CrossRef] [Google Scholar]
- Hewett, P. C.,& Foltz, C. B. 2003, AJ, 125, 1784 [NASA ADS] [CrossRef] [Google Scholar]
- Hines, D. C., Schmidt, G. D., & Smith, P. S. 1999, ApJ, 514, L91 [NASA ADS] [CrossRef] [Google Scholar]
- Ibata, R. A., Lewis, G. F., Irwin, M. J., Lehár, J., & Totten, E. J. 1999, AJ, 118, 1922 [NASA ADS] [CrossRef] [Google Scholar]
- Irwin, M. J., Ibata, R. A., Lewis, G. F., & Totten, E. J. 1998, ApJ, 505, 529 [NASA ADS] [CrossRef] [Google Scholar]
- Kaspi, S., Brandt, W. N., Maoz, D., et al. 2007, ApJ, 659, 997 [NASA ADS] [CrossRef] [Google Scholar]
- Knigge, C., Scaringi, S., Goad, M. R., & Cottis, C. E. 2008, MNRAS, 386, 1426 [NASA ADS] [CrossRef] [Google Scholar]
- Labiano, A., Azzollini, R., Bailey, J., et al. 2016, in Observatory Operations: Strategies, Processes, and Systems VI, Proc. SPIE, 9910, 99102W [Google Scholar]
- Ledoux, C., Theodore, B., Petitjean, P., et al. 1998, A&A, 339, L77 [NASA ADS] [Google Scholar]
- Lewis, G. F., Robb, R. M., & Ibata, R. A. 1999, PASP, 111, 1503 [NASA ADS] [CrossRef] [Google Scholar]
- Lewis, G. F., Carilli, C., Papadopoulos, P., & Ivison, R. J. 2002a, MNRAS, 330, L15 [NASA ADS] [CrossRef] [Google Scholar]
- Lewis, G. F., Ibata, R. A., Ellison, S. L., et al. 2002b, MNRAS, 334, L7 [NASA ADS] [CrossRef] [Google Scholar]
- Lundgren, B. F., Wilhite, B. C., Brunner, R. J., et al. 2007, ApJ, 656, 73 [NASA ADS] [CrossRef] [Google Scholar]
- Marconi, A., Axon, D. J., Maiolino, R., et al. 2008, ApJ, 678, 693 [NASA ADS] [CrossRef] [Google Scholar]
- Marconi, A., Axon, D. J., Maiolino, R., et al. 2009, ApJ, 698, L103 [NASA ADS] [CrossRef] [Google Scholar]
- Markwardt, C. B. 2009, in Astronomical Data Analysis Software and Systems XVIII, eds. D. A. Bohlender, D. Durand, & P. Dowler, ASP Conf. Ser., 411, 251 [NASA ADS] [Google Scholar]
- Marziani, P., Sulentic, J. W., Plauchu-Frayn, I., & del Olmo A. 2013, ApJ, 764, 150 [NASA ADS] [CrossRef] [Google Scholar]
- Marziani, P., Martínez Carballo, M. A., Sulentic, J. W., et al. 2016, Ap&SS, 361, 29 [NASA ADS] [CrossRef] [Google Scholar]
- Netzer, H., Shemmer, O., Maiolino, R., et al. 2004, ApJ, 614, 558 [NASA ADS] [CrossRef] [Google Scholar]
- Ojha, R., Zacharias, N., Hennessy, G. S., Gaume, R. A., & Johnston, K. J. 2009, AJ, 138, 845 [NASA ADS] [CrossRef] [Google Scholar]
- Onken, C. A., Ferrarese, L., Merritt, D., et al. 2004, ApJ, 615, 645 [NASA ADS] [CrossRef] [Google Scholar]
- Oyabu, S., Kawara, K., Tsuzuki, Y., et al. 2009, ApJ, 697, 452 [NASA ADS] [CrossRef] [Google Scholar]
- Pancoast, A., Brewer, B. J., Treu, T., et al. 2014, MNRAS, 445, 3073 [NASA ADS] [CrossRef] [Google Scholar]
- Pancoast, A., Brewer, B. J., Treu, T., et al. 2015, MNRAS, 448, 3070 [NASA ADS] [CrossRef] [Google Scholar]
- Park, D., Kelly, B. C., Woo, J.-H., & Treu, T. 2012, ApJS, 203, 6 [NASA ADS] [CrossRef] [Google Scholar]
- Pei, Y. C. 1992, ApJ, 395, 130 [NASA ADS] [CrossRef] [Google Scholar]
- Peterson, B. M. 1997, An Introduction to Active Galactic Nuclei (Cambridge, New York: Cambridge University Press) [CrossRef] [Google Scholar]
- Petitjean, P., Aracil, B., Srianand, R., & Ibata, R. 2000, A&A, 359, 457 [NASA ADS] [Google Scholar]
- Proga, D., & Kallman, T. R. 2004, ApJ, 616, 688 [Google Scholar]
- Reichard, T. A., Richards, G. T., Hall, P. B., et al. 2003, AJ, 126, 2594 [NASA ADS] [CrossRef] [Google Scholar]
- Richards, G. T., Vanden Berk, D. E., Reichard, T. A., et al. 2002, AJ, 124, 1 [NASA ADS] [CrossRef] [Google Scholar]
- Richards, G. T., Hall, P. B., Vanden Berk, D. E., et al. 2003, AJ, 126, 1131 [NASA ADS] [CrossRef] [Google Scholar]
- Richards, G. T., Kruczek, N. E., Gallagher, S. C., et al. 2011, AJ, 141, 167 [NASA ADS] [CrossRef] [Google Scholar]
- Riechers, D. A., Walter, F., Carilli, C. R., & Lewis, G. F. 2009, ApJ, 690, 463 [NASA ADS] [CrossRef] [Google Scholar]
- Risaliti, G., & Elvis, M. 2010, A&A, 516, A89 [NASA ADS] [CrossRef] [EDP Sciences] [Google Scholar]
- Rowan-Robinson, M. 2000, MNRAS, 316, 885 [Google Scholar]
- Runnoe, J. C., Brotherton, M. S., & Shang, Z. 2012a, MNRAS, 427, 1800 [NASA ADS] [CrossRef] [Google Scholar]
- Runnoe, J. C., Brotherton, M. S., & Shang, Z. 2012b, MNRAS, 422, 478 [NASA ADS] [CrossRef] [Google Scholar]
- Saez, C., & Chartas, G. 2011, ApJ, 737, 91 [Google Scholar]
- Saez, C., Chartas, G., & Brandt, W. N. 2009, ApJ, 697, 194 [NASA ADS] [CrossRef] [Google Scholar]
- Saturni, F. G., Trevese, D., Vagnetti, F., & Perna, M. 2014, Adv. Space Res., 54, 1434 [NASA ADS] [CrossRef] [Google Scholar]
- Saturni, F. G., Trevese, D., Vagnetti, F., Perna, M., & Dadina, M. 2016, A&A, 587, A43 [NASA ADS] [CrossRef] [EDP Sciences] [Google Scholar]
- Shen, Y. 2016, ApJ, 817, 55 [NASA ADS] [CrossRef] [Google Scholar]
- Shen, Y., & Ho, L. C. 2014, Nature, 513, 210 [NASA ADS] [CrossRef] [Google Scholar]
- Shen, Y., & Liu, X. 2012, ApJ, 753, 125 [NASA ADS] [CrossRef] [Google Scholar]
- Shen, Y., Richards, G. T., Strauss, M. A., et al. 2011, ApJS, 194, 45 [NASA ADS] [CrossRef] [Google Scholar]
- Srianand, R., & Petitjean, P. 2000, A&A, 357, 414 [NASA ADS] [Google Scholar]
- Stern, J., Hennawi, J. F., & Pott, J.-U. 2015, ApJ, 804, 57 [NASA ADS] [CrossRef] [Google Scholar]
- Trevese, D., Paris, D., Stirpe, G. M., Vagnetti, F., & Zitelli, V. 2007, A&A, 470, 491 [NASA ADS] [CrossRef] [EDP Sciences] [Google Scholar]
- Trevese, D., Saturni, F. G., Vagnetti, F., et al. 2013, A&A, 557, A91 [NASA ADS] [CrossRef] [EDP Sciences] [Google Scholar]
- Trevese, D., Perna, M., Vagnetti, F., Saturni, F. G., & Dadina, M. 2014, ApJ, 795, 164 [NASA ADS] [CrossRef] [Google Scholar]
- Trump, J. R., Hall, P. B., Reichard, T. A., et al. 2006, ApJS, 165, 1 [NASA ADS] [CrossRef] [Google Scholar]
- Tsuzuki, Y., Kawara, K., Yoshii, Y., et al. 2006, ApJ, 650, 57 [NASA ADS] [CrossRef] [Google Scholar]
- Urrutia, T., Becker, R. H., White, R. L., et al. 2009, ApJ, 698, 1095 [NASA ADS] [CrossRef] [Google Scholar]
- Vanden Berk, D. E., Richards, G. T., Bauer, A., et al. 2001, AJ, 122, 549 [NASA ADS] [CrossRef] [Google Scholar]
- Véron-Cetty, M.-P., Joly, M., & Véron, P. 2004, A&A, 417, 515 [NASA ADS] [CrossRef] [EDP Sciences] [Google Scholar]
- Vestergaard, M., & Peterson, B. M. 2006, ApJ, 641, 689 [NASA ADS] [CrossRef] [Google Scholar]
- Vestergaard, M., & Wilkes, B. J. 2001, ApJS, 134, 1 [NASA ADS] [CrossRef] [Google Scholar]
- Vietri, G., Piconcelli, E., Bischetti, M., et al. 2018, A&A, 617, A81 [NASA ADS] [CrossRef] [EDP Sciences] [Google Scholar]
- Weymann, R. J., Morris, S. L., Foltz, C. B., & Hewett, P. C. 1991, ApJ, 373, 23 [NASA ADS] [CrossRef] [Google Scholar]
- Wu, J., Vanden Berk, D. E., Brandt, W. N., et al. 2009, ApJ, 702, 767 [NASA ADS] [CrossRef] [Google Scholar]
- Zuo, W., Wu, X.-B., Fan, X., et al. 2015, ApJ, 799, 189 [NASA ADS] [CrossRef] [Google Scholar]
We note that this result strictly holds only assuming a form factor f = 5.5 (Onken et al. 2004) for the high-ionization BLR. Other choices of the value of f based on different calibrations of the BH mass-to-velocity dispersion relations (Graham et al. 2011; Park et al. 2012; Grier et al. 2013; Shen & Ho 2014) or on the study of BLR geometry (Pancoast et al. 2014, 2015) are possible.
All Tables
Optical-to-near infrared Vega magnitudes of APM 08279+5255 in the observer frame available in the literature.
APM 08279+5255 indexes of absorptionassociated to the main BAL transitions in quasars.
Spectral fit results derived for the Hβ+[O III] and Mg II regions of APM 08279+5255.
SMBH mass and Eddington ratio of APM 08279+5255 derived from Hβ, Mg II and C IV broad emission lines, as a function of the magnification parameter μ.
All Figures
|
Fig. 1 Calibrated spectrum of APM 08279+5255 before (green dashed line) and after dereddening (black solid line), with corresponding 1σ uncertainty (gray band) – see Sect. 2. Superimposed to the data, the composite quasar template obtained by matching the Vanden Berk et al. (2001) and Glikman et al. (2006) templates around λ ~ 3000 Å in the restframe (red line) is shown. The continuum level is marked as a black dotted line with slope − 1.54. A residual telluric absorption is still present between λ ~ 17 500 Å and 20 000 Å (cyan shaded area), hence this spectral interval is excluded from the present analysis. |
| In the text | |
|
Fig. 2 Flux of APM 08279+5255 normalized to the Vanden Berk et al. (2001) and Glikman et al. (2006) joint quasar template. The spectral regions around the Si IV emission (top left panel), the C IV emission (top right panel), the Al III emission (bottom left panel) and the Mg II emission (bottom right panel) are shown. In all panels, the velocity scale is relative to the systemic redshift z = 3.911 derived fromthe CO(4 − 3) and CO(9 − 8) emission lines (Downes et al. 1999). As a guidance, the zero-velocity position (dot-dashed line) and the normalized flux level (dashed line) are indicated. |
| In the text | |
|
Fig. 3 NICS spectrum of APM 08279+5255 corresponding to the Mg II and Hβ+[O III] spectral regions. Specifically, panel a shows the best fit description of the restframe ~ 2200−3400 Å band. Panel b and its inset show the best-fit description of the restframe ~ 3990−5040 Å band according to models A and B, respectively. In all panels, a purple solid line marks the power-law quasar continuum. Blue dashed curves refer to Mg II, Hγ, and Hβ emission lines, whereas the Fe II emission is plotted as magenta dot-dashed lines. In model B, the green curve refers to the [O III] emission. Gray bands indicate the regions excluded from the fit because of the presence of telluric features. |
| In the text | |
|
Fig. 4 Velocity shifts of the Hβ (blue), Mg II (red) and C IV (green) lines with respect to z = 3.911. The centroids of the best fit Gaussian profiles resulting from our analysis (Hβ and Mg II) and Saturni et al. (2016, C IV, based on high-resolution HST/STIS data) are indicated by vertical lines with the corresponding uncertainties (shaded vertical bands). |
| In the text | |
Current usage metrics show cumulative count of Article Views (full-text article views including HTML views, PDF and ePub downloads, according to the available data) and Abstracts Views on Vision4Press platform.
Data correspond to usage on the plateform after 2015. The current usage metrics is available 48-96 hours after online publication and is updated daily on week days.
Initial download of the metrics may take a while.