Fig. 3
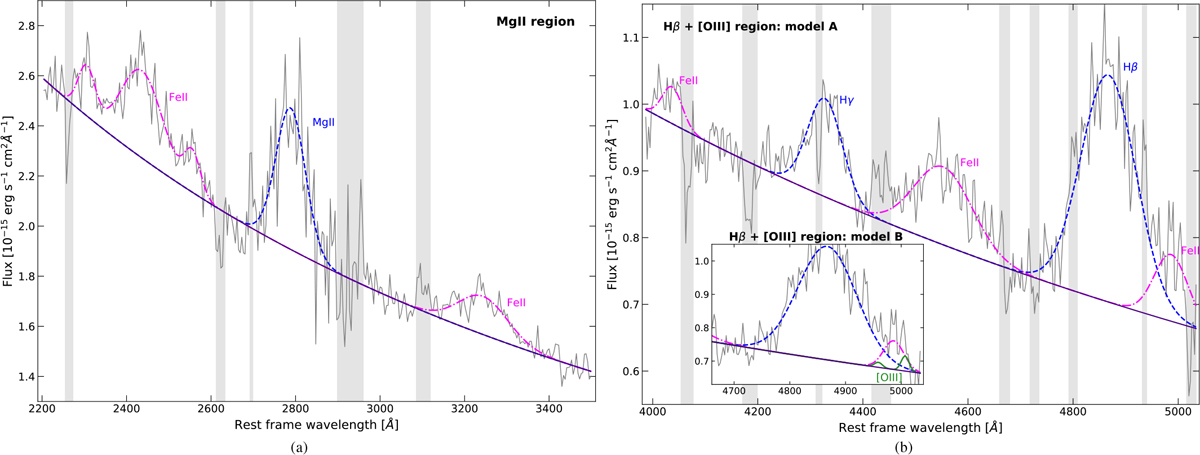
NICS spectrum of APM 08279+5255 corresponding to the Mg II and Hβ+[O III] spectral regions. Specifically, panel a shows the best fit description of the restframe ~ 2200−3400 Å band. Panel b and its inset show the best-fit description of the restframe ~ 3990−5040 Å band according to models A and B, respectively. In all panels, a purple solid line marks the power-law quasar continuum. Blue dashed curves refer to Mg II, Hγ, and Hβ emission lines, whereas the Fe II emission is plotted as magenta dot-dashed lines. In model B, the green curve refers to the [O III] emission. Gray bands indicate the regions excluded from the fit because of the presence of telluric features.
Current usage metrics show cumulative count of Article Views (full-text article views including HTML views, PDF and ePub downloads, according to the available data) and Abstracts Views on Vision4Press platform.
Data correspond to usage on the plateform after 2015. The current usage metrics is available 48-96 hours after online publication and is updated daily on week days.
Initial download of the metrics may take a while.