Fig. 2
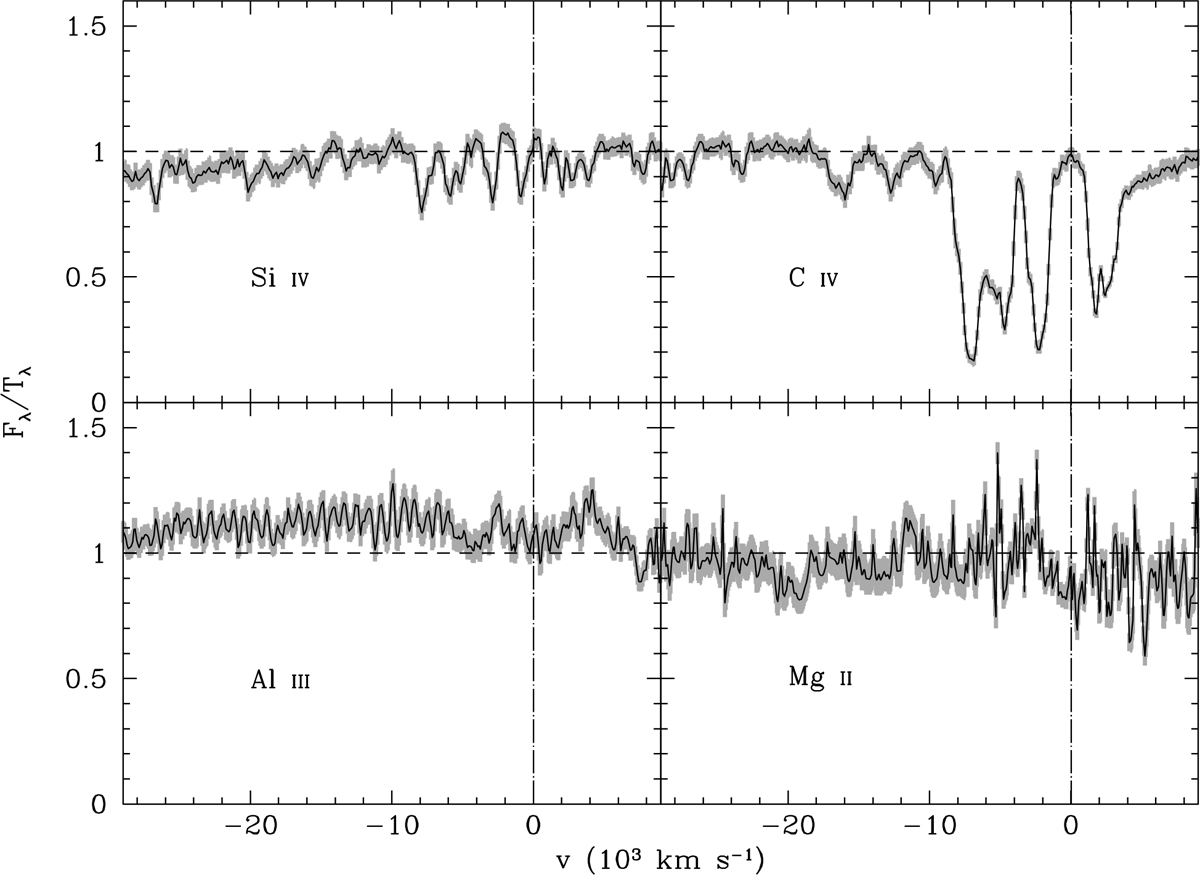
Flux of APM 08279+5255 normalized to the Vanden Berk et al. (2001) and Glikman et al. (2006) joint quasar template. The spectral regions around the Si IV emission (top left panel), the C IV emission (top right panel), the Al III emission (bottom left panel) and the Mg II emission (bottom right panel) are shown. In all panels, the velocity scale is relative to the systemic redshift z = 3.911 derived fromthe CO(4 − 3) and CO(9 − 8) emission lines (Downes et al. 1999). As a guidance, the zero-velocity position (dot-dashed line) and the normalized flux level (dashed line) are indicated.
Current usage metrics show cumulative count of Article Views (full-text article views including HTML views, PDF and ePub downloads, according to the available data) and Abstracts Views on Vision4Press platform.
Data correspond to usage on the plateform after 2015. The current usage metrics is available 48-96 hours after online publication and is updated daily on week days.
Initial download of the metrics may take a while.